
Four-Phase Cyclin-CDK Oscillation Clock
Four-phase cell cycle oscillation clock showing Cyclin D-CDK4/6, Cyclin E-CDK2, Cyclin A-CDK2, and Cyclin B-CDK1 relays.
G1/S/G2/M
Use the Cell Cycle Diagram Generator to create clear, journal-quality figures. Map G1, S, G2, and M phase transitions, Cyclin-CDK oscillating complexes, Rb-E2F regulation, and p53/p21 DNA damage arrest.
Free to try ·
Your diagram will appear here
Describe what you need and click Generate
Move from experimental pathway notes to a structured, reviewable figure ready for manuscript or slide preparation.
Describe the upstream triggers, protein complexes, cofactors, and organelle membranes that anchor your biological mechanism.
Check activation arrowheads, inhibitory bars, membrane translocations, and feedback loops against your experimental data.
Download high-resolution 4K rasters, layered SVG vectors, or native PPTX slides to customize labels and colors before submission.
Describe the upstream triggers, protein complexes, cofactors, and organelle membranes that anchor your biological mechanism.
Check activation arrowheads, inhibitory bars, membrane translocations, and feedback loops against your experimental data.
Download high-resolution 4K rasters, layered SVG vectors, or native PPTX slides to customize labels and colors before submission.
Explore high-density scientific diagrams created with SciDraw AI. Fully editable in SVG and PPTX.
Four-phase cell cycle oscillation clock showing Cyclin D-CDK4/6, Cyclin E-CDK2, Cyclin A-CDK2, and Cyclin B-CDK1 relays.
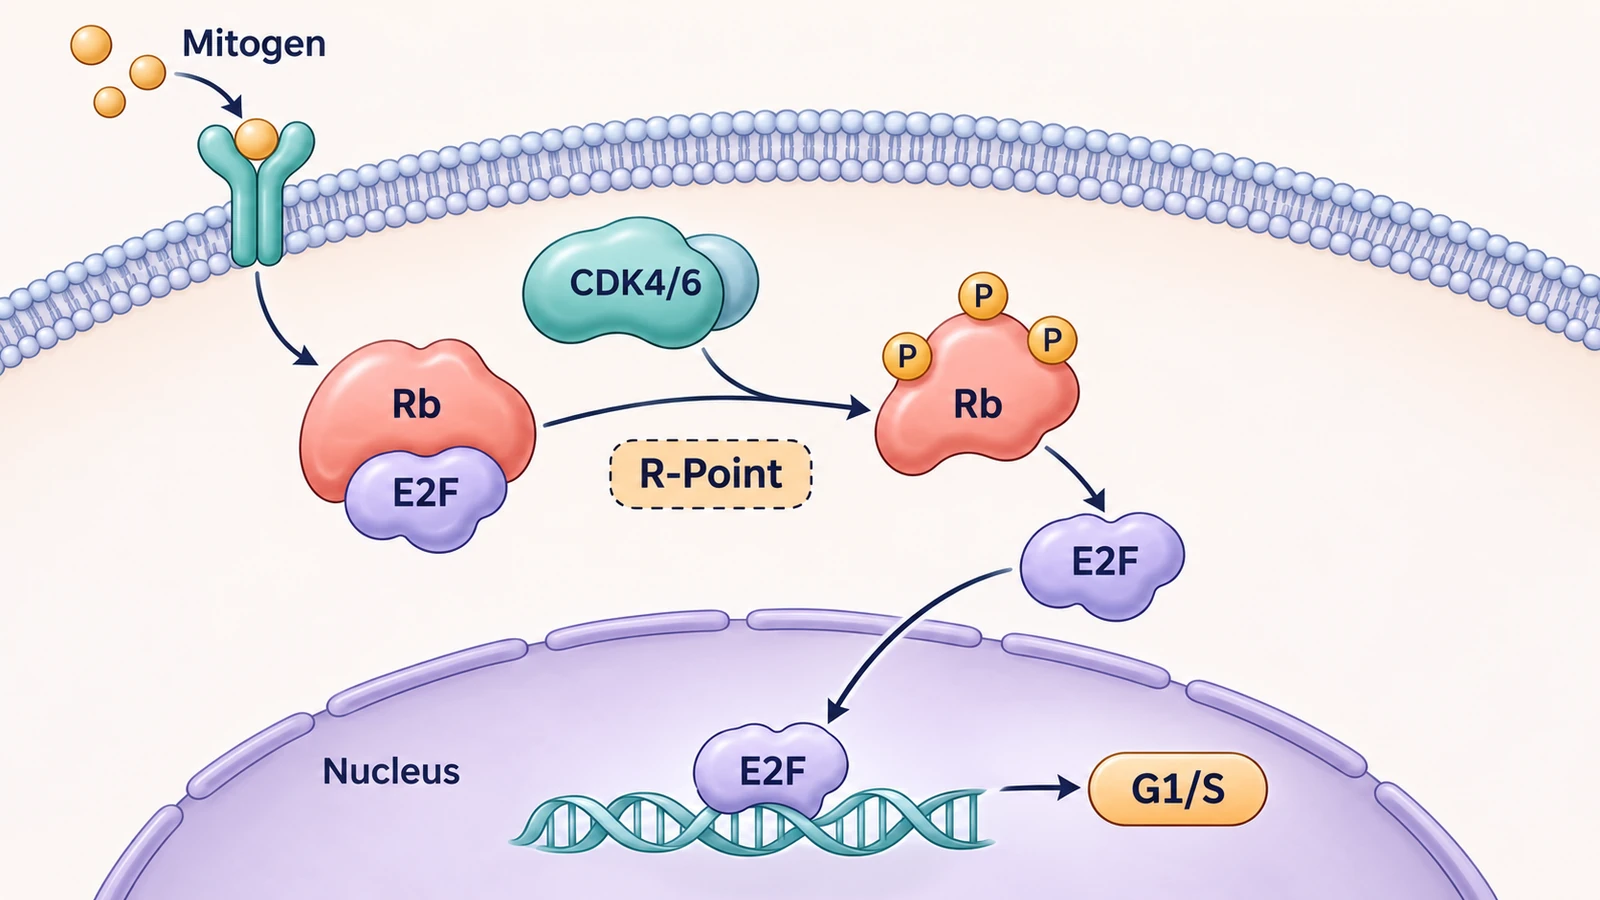
G1/S restriction point diagram showing mitogen-driven CDK4/6 phosphorylation of Rb releasing E2F transcription factors.
p53 and p21 DNA damage checkpoint diagram showing ATM/ATR activation and p21 CIP1/WAF1 inhibition of CDK complexes.
Spindle assembly checkpoint diagram illustrating kinetochore tension sensing, Mad2-Cdc20 restraint, and Separase activation.
DNA replication origin licensing diagram detailing pre-replicative complex formation and S-CDK DDK firing.
CDK4/6 inhibitor mechanism diagram showing palbociclib preventing Rb phosphorylation to lock cancer cells in G1 arrest.
SciDraw can help draft a scientific visual. Check all labels, relationships, and claims against your source before use.
Workflow Need | SciDraw AI | Generic Image AI |
|---|---|---|
Scientific Entity & Complex Accuracy | Organizes canonical protein complexes, phosphorylation states, and readable English nomenclature. | Often invents non-existent protein shapes, garbled gene symbols, and unreadable pseudo-text. |
Biochemical Arrow & Compartmental Logic | Clearly distinguishes activation arrows (→), inhibition bars (⊣), and organelle membrane boundaries. | Places arrows arbitrarily without membrane topology or clear distinction between activation and repression. |
Downstream Vector & Slide Editability | Exports layered SVG vectors and PowerPoint (PPTX) slides with independently editable text labels. | Outputs flattened raster pixels where text typos and layout issues cannot be fixed. |
Multi-Resolution & Presentation Output | Supports 16:9 widescreen, 2K/4K export, and reference-guided animation for talks and manuscripts. | Unpredictable aspect ratios and low resolution that require manual redrawing. |
Follow proven scientific visualization principles to ensure your diagrams are accurate, legible, and aligned with journal requirements.
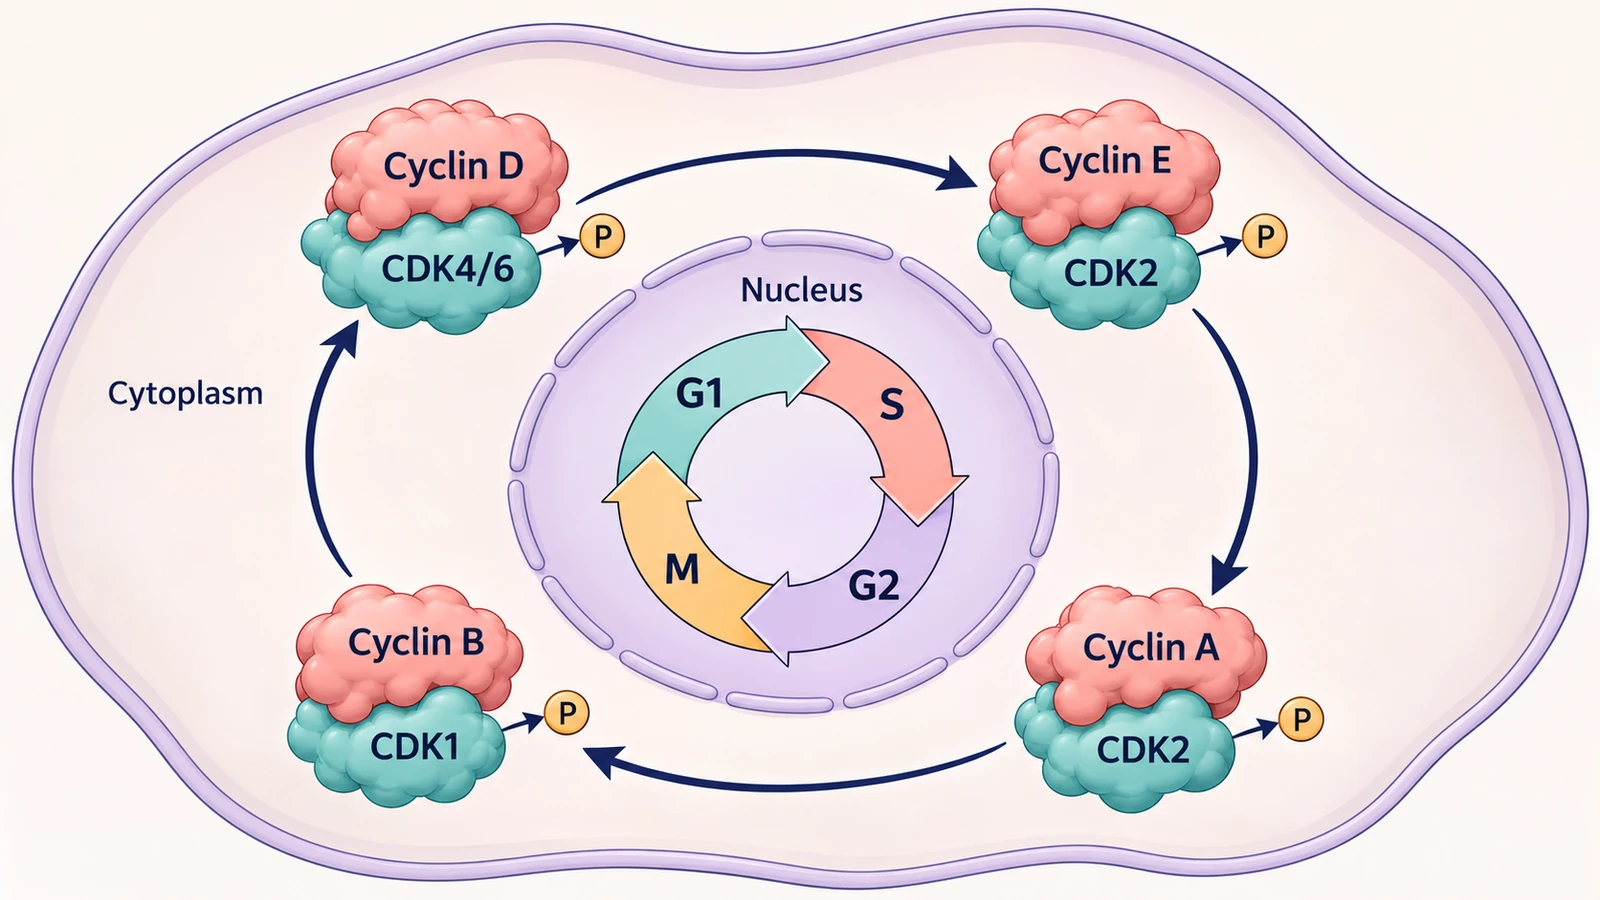
Eukaryotic cell division is driven by unidirectional waves of cyclin-dependent kinase (CDK) activity. Early G1 phase relies on Cyclin D pairing with CDK4 and CDK6 in response to mitogenic signaling. Progressing through the restriction point requires Cyclin E–CDK2, while S phase entry and DNA replication are maintained by Cyclin A–CDK2 and Cyclin A–CDK1. Finally, mitotic entry is triggered by the surge of Cyclin B–CDK1 (MPF).
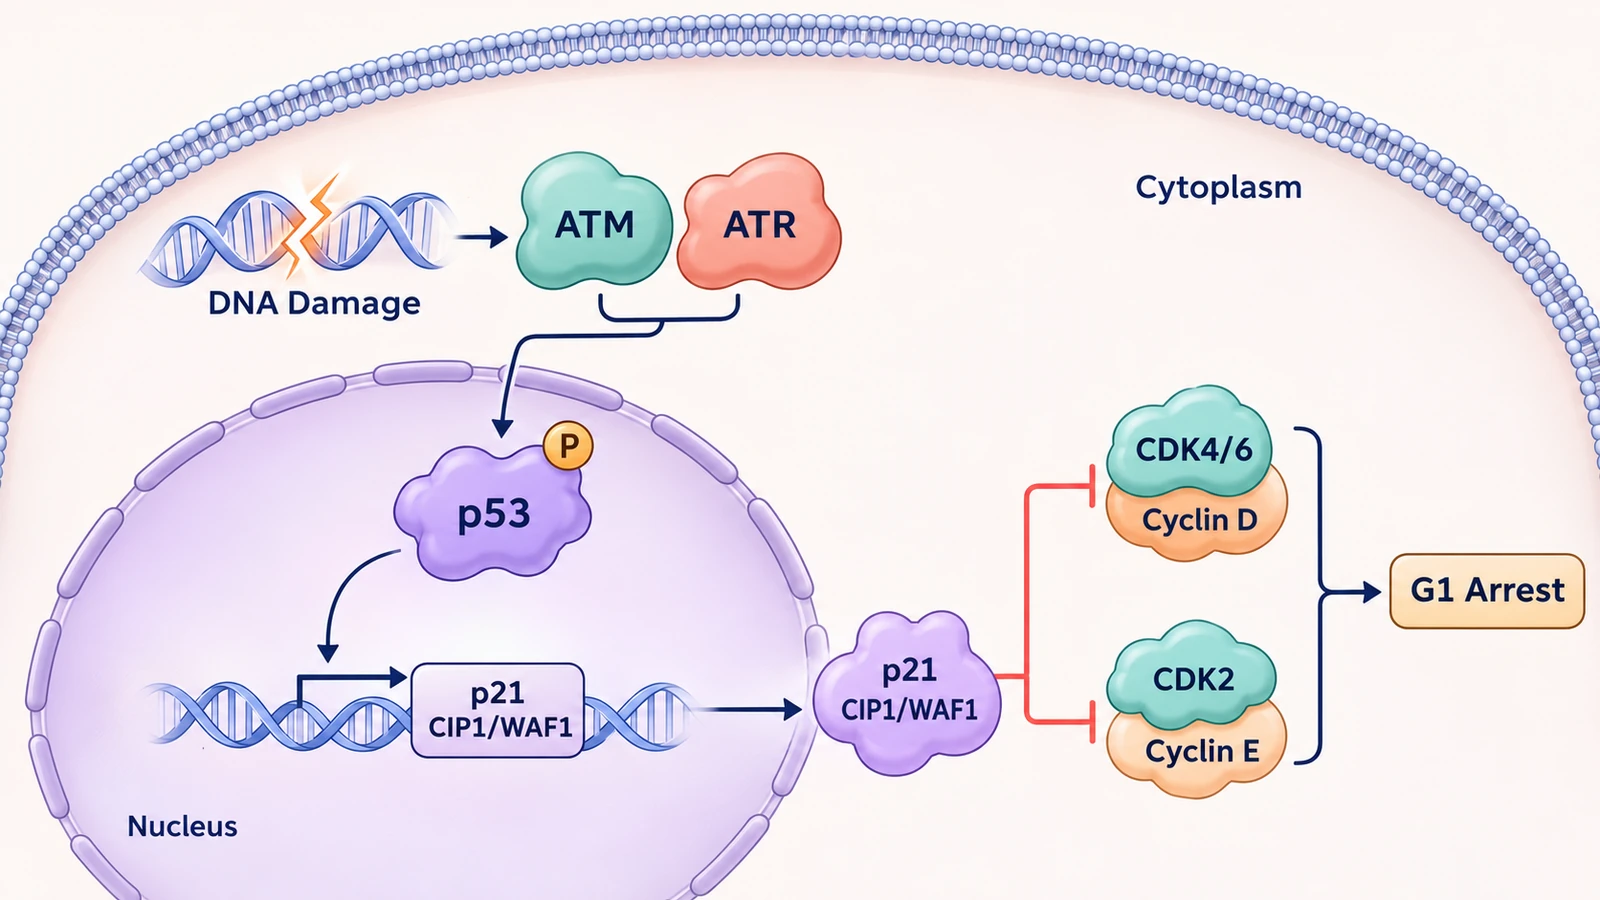
Standard biomedical publishing standards require rigorous mapping of surveillance checkpoints. The G1/S DNA damage checkpoint senses double-strand breaks via ATM and single-strand lesions via ATR, activating Chk2/Chk1 to phosphorylate and stabilize p53. Stabilized p53 transactivates p21 (CIP1/WAF1), a universal CDK inhibitor that blocks CDK2 and arrests cells before replication.
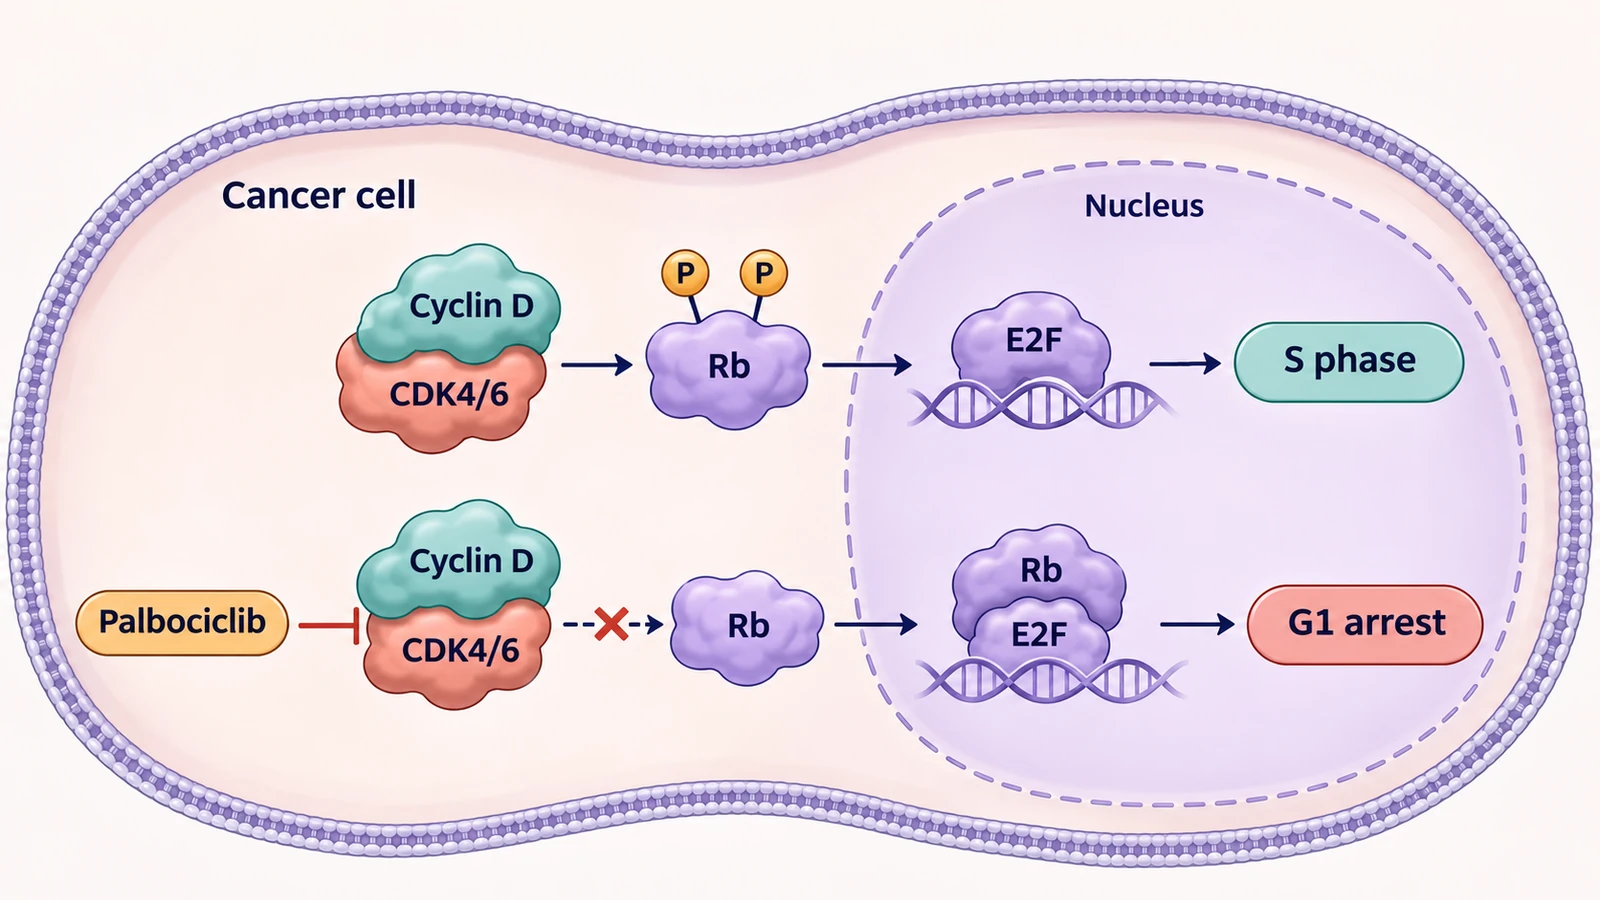
When drafting figures for oncology manuscripts or conference presentations, clearly annotate targeted therapeutics such as CDK4/6 inhibitors (palbociclib, ribociclib, abemaciclib) or Wee1/ATR inhibitors. Use consistent circular or progressive flow diagrams that clearly convey irreversible state transitions governed by ubiquitin ligases (SCF and APC/C).
A single pathway or mechanism figure often serves multiple communication needs—from a two-column manuscript panel to a 16:9 conference slide or grant schematic. Plan your visual hierarchy so labels and compartments remain clear across formats:
Choose your plan. No hidden fees, cancel anytime.
Your data is yours · Never used to train any model · Encrypted in transit and at rest
Great for getting started
Includes
Best for regular creation
Includes
Built for high-volume production
Includes









Researchers, graduate students, and educators share how SciDraw helps them create scientific figures, scientific diagrams, graphical abstracts, and clearer teaching visuals faster.
For a plant-cell lecture, I needed the chloroplasts and vacuole called out without rebuilding an old slide. SciDraw gave me a useful scientific figure layout that went into my slide deck after only a few label edits.

Dr. Helen Vance
Cell Biology Professor
When a student asks for a force-diagram example beyond the textbook, I open SciDraw instead of redrawing one on a slide. It is the scientific diagram generator I reach for first, then I quickly check every vector.

Dr. Javier Ortega
Physics Instructor
For grant proposals, we use SciDraw to agree on the experimental setup diagram before anyone starts polishing the scientific figure. It has cut down the back-and-forth and given the team a shared visual from day one.

Dr. Devendra Verma
Research Lab Director
I can compare a few biological pathway diagrams for study notes before I settle on one.

Minh Nguyen
Graduate Science Student
For my dissertation, I start the manuscript-to-figure process with neural-pathway and synapse layouts in SciDraw. It gives me a strong first composition, so I can spend Illustrator time on the details that matter.

Dr. Ananya Rao
PhD Candidate · Neuroscience
The first scientific drawing got our fractional-distillation design review moving right away.

Dr. Marcus Davis
Chemical Engineering Lead
If the stock image does not match that week’s climate topic, I make a quick diagram in SciDraw. It gives the class a visual that fits the discussion, and I can tailor the labels to their level.

Prof. Mei-Ling Zhao
Environmental Science Educator
I see authors use a scientific figure generator to turn a rough outline into something reviewers can actually read. It makes the first review conversation clearer and helps the science stand out from the layout.

Dr. Thomas Ødegård
Scientific Journal Editor
For tectonics classes, I use a custom volcano cross-section diagram when the stock image does not match the boundary we are discussing. Students grasp the process much faster when the visual follows the exact example.

Dr. Fatima Al-Sayed
Geology Lecturer
It gives me a tidy scientific figure draft for a force diagram or wave sketch quickly, without making the curriculum page feel crowded.

Dr. Nathan Brooks
STEM Developer
I place a simple materials-science diagram next to SEM images so students can connect an ideal lattice to the real sample. That visual comparison makes the lesson click much faster than another paragraph of explanation.

Dr. Clara Sommer
Materials Researcher
Before opening CAD, we use SciDraw’s architecture diagram generator to make the system boundary and handoffs visible. It gets the right questions onto the table early and helps the team align before detailed modeling.

Dr. Robert Söderberg
Mechanical Engineer
For photosynthesis slides, I start with a chloroplast scientific figure that I can tailor to the level of the class. It saves a surprising amount of preparation time when a lesson needs a fresh visual.

Dr. Hannah Weber
Plant Biology Researcher
It gets me past the blank page on a science explainer and gives the final illustration a clearer direction.

Ji-Min Kim
Scientific Content Creator
Having students create a scientific drawing for a lab report makes them think through the process step by step. The discussion and revision afterwards are noticeably stronger.

Dr. Sofia Alvarez
Biochemistry Professor
It is helpful when we need an astronomy diagram for the exact orbit or instrument configuration in the discussion, rather than a generic solar-system graphic. The result feels much closer to the research question.

Dr. David Park
Astronomical Researcher
A labeled ecology figure gives our postdoc meetings something concrete to point at when we discuss feedback loops. It keeps the discussion focused and helps us reach a paper figure faster.

Dr. Lisa Wang
Ecology Postdoc
For multi-panel papers, I use the manuscript-to-figure workflow to decide what each panel needs to do before Illustrator. It makes the first layout decisions faster and leaves more time for the final polish.

Carlos Ortega
Illustrator Assistant
For early circuit and network reviews, I use SciDraw’s architecture diagram generator to get a first pass on the page. The team can mark it up together instead of building slides from fragments, which makes decisions quicker.

Dr. Elena Gomez
Systems Engineering Lead
For public-facing science guides, clear scientific diagrams often travel better than a dense block of text. They make complex ideas easier to share across languages and give us a strong starting point for the final guide.

Dr. Michael Achebe
Science Communicator
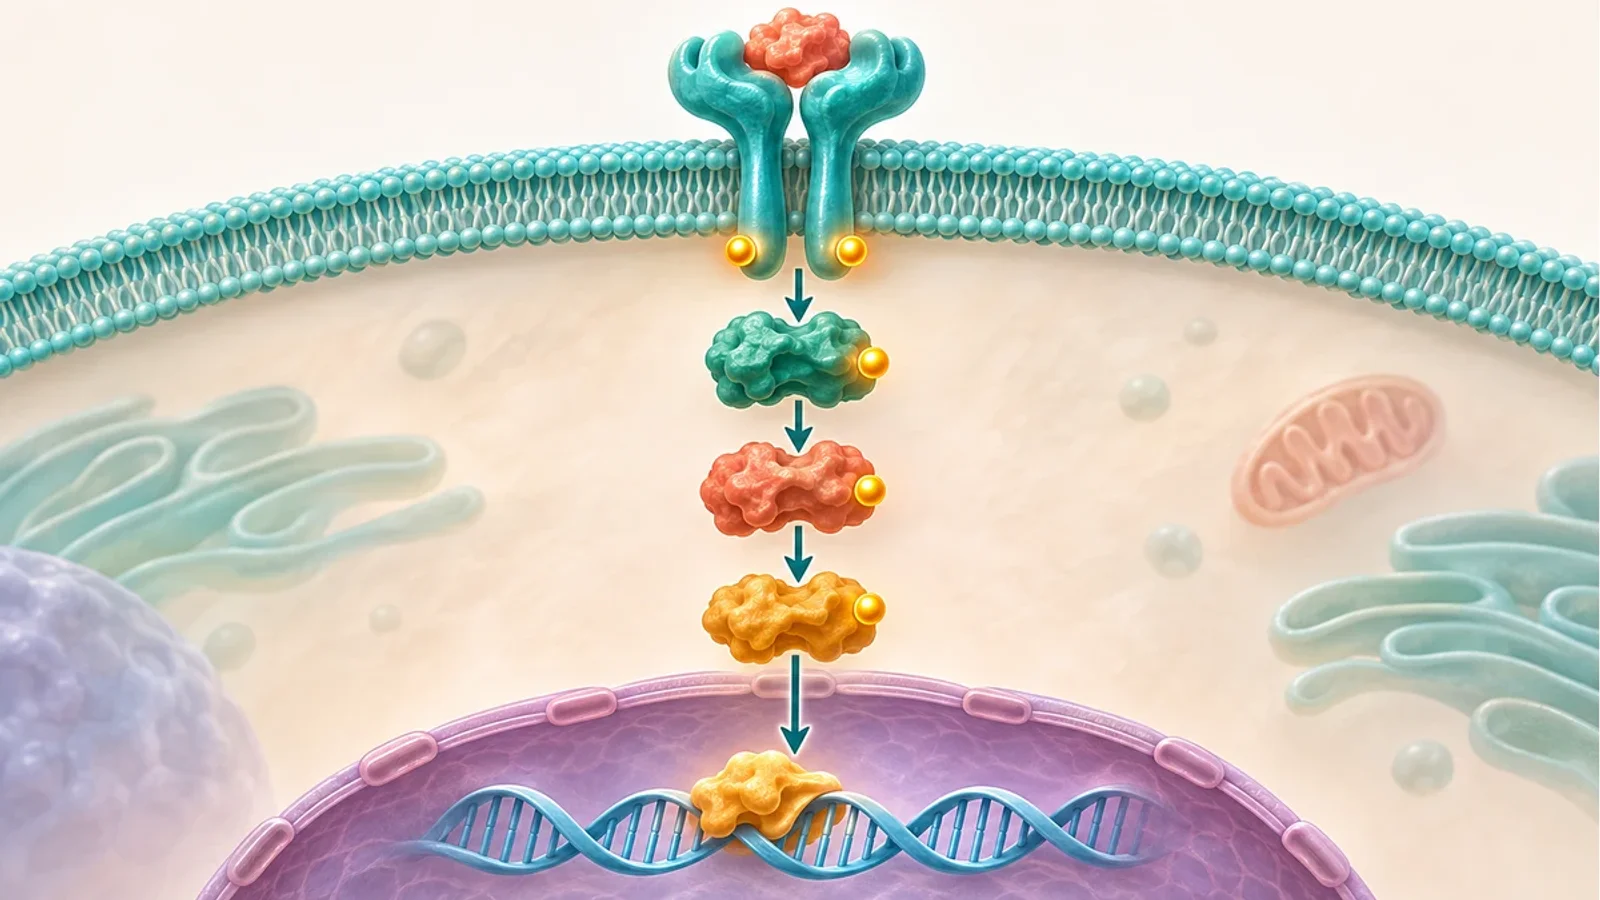 Biology
Create publication-grade signaling pathway diagrams for receptor cascades, phosphorylation relays, and transcriptional responses with structured English labels.
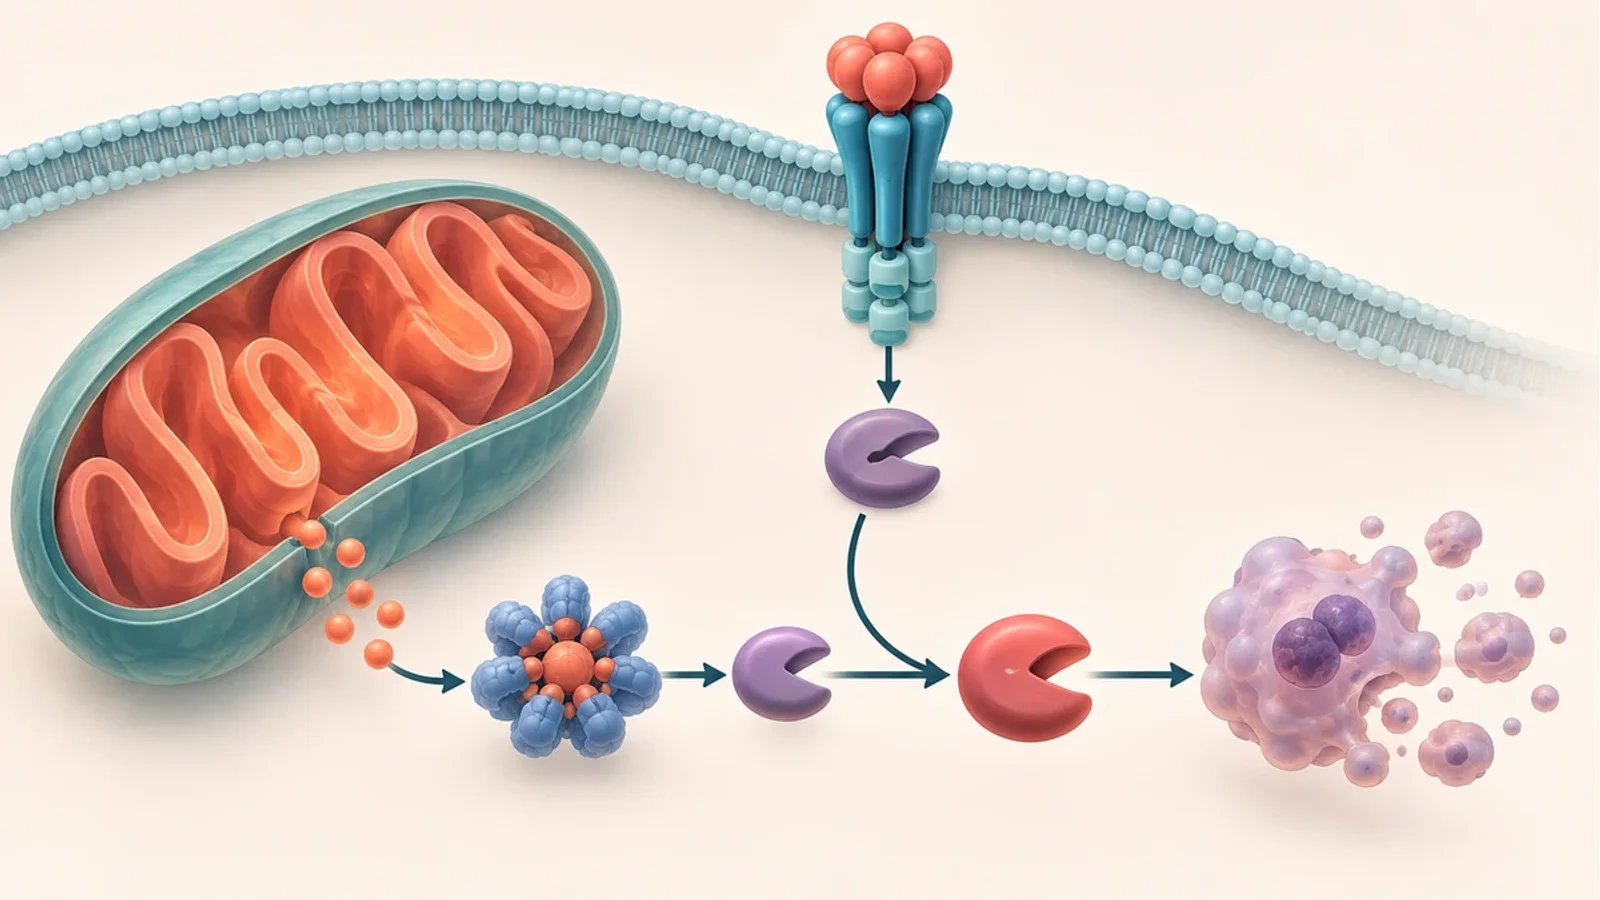 Biology
Create journal-quality apoptosis pathway diagrams for intrinsic mitochondrial release, extrinsic death receptors, DISC assembly, and caspase cascades.
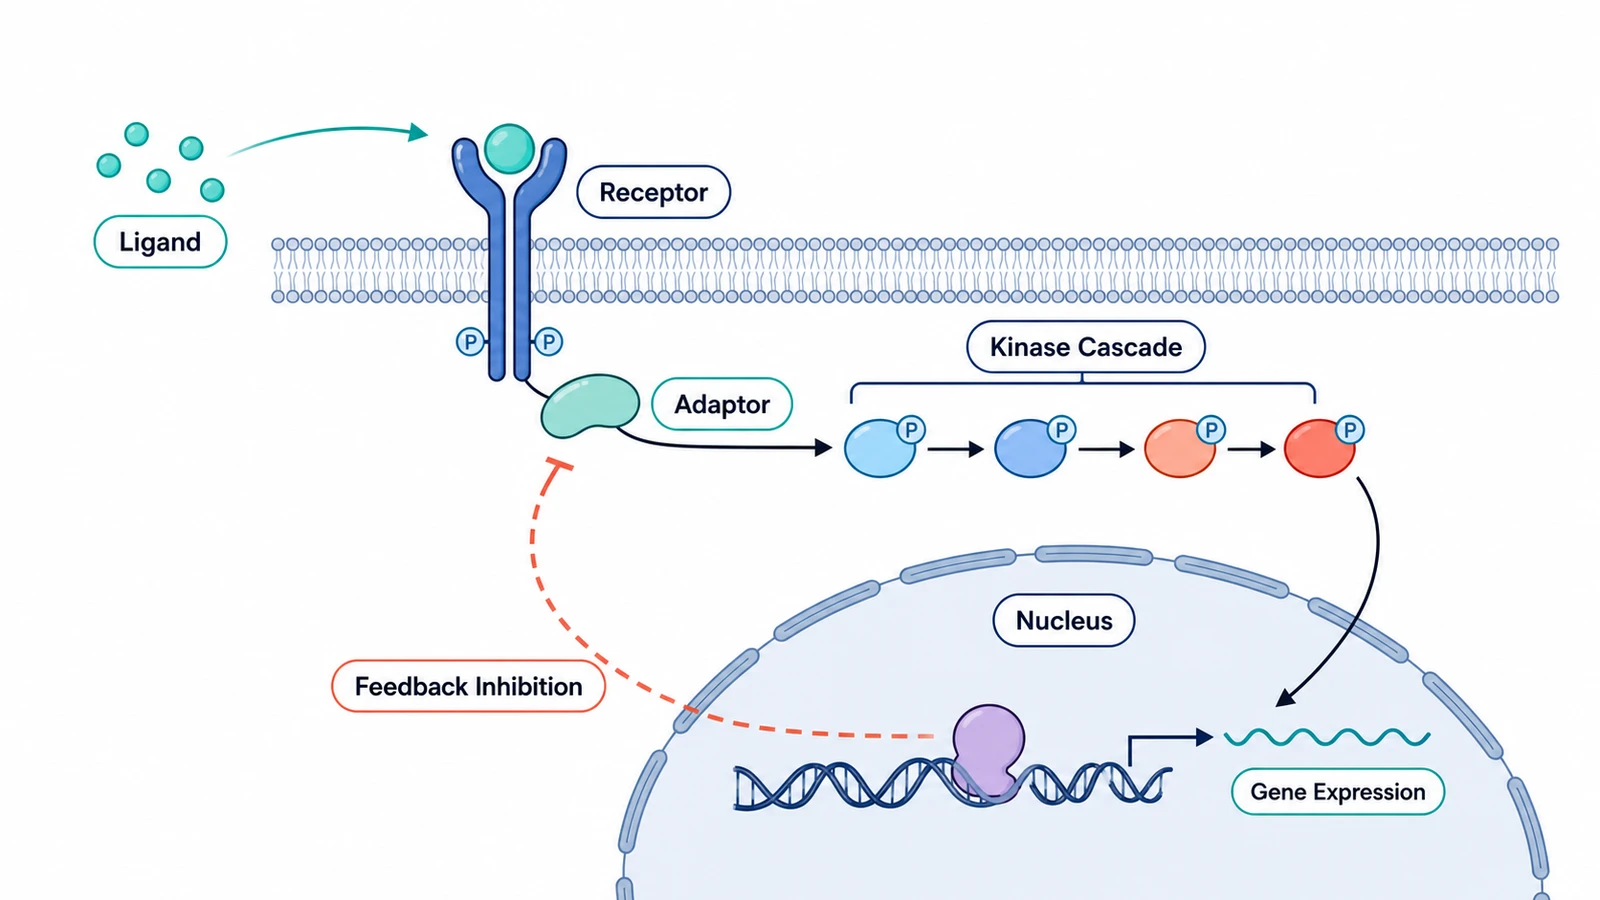 Biology
Create biological pathway diagrams showing signaling cascades, metabolic routes, and gene regulation networks.