
RTK / MAPK / ERK Cascade
Growth factor binding, receptor dimerization, Ras-GTP activation, and sequential Raf-MEK-ERK phosphorylation.
RTK
Use the Signaling Pathway Diagram Generator to transform complex biochemical cascades into clear, publication-grade figures. Detail receptors, kinase relays, phosphorylation sites, second messengers, and nuclear outcomes, then review every arrow against experimental evidence.
Free to try ·
Your diagram will appear here
Describe what you need and click Generate
Move from experimental brief to a structured, reviewable pathway diagram. SciDraw AI organizes your cellular compartments, molecular interactions, and regulatory loops before final publication.
Specify the upstream stimulus, surface receptor, intermediate kinase cascade, and transcriptional outcome.
SciDraw AI renders compartmentalized membranes, directional arrows, phosphorylation flags, and concise English labels.
Verify arrow directions and inhibition marks against your data. Export in 4K, layered SVG, or editable PowerPoint (PPTX).
Specify the upstream stimulus, surface receptor, intermediate kinase cascade, and transcriptional outcome.
SciDraw AI renders compartmentalized membranes, directional arrows, phosphorylation flags, and concise English labels.
Verify arrow directions and inhibition marks against your data. Export in 4K, layered SVG, or editable PowerPoint (PPTX).
Six independent 16:9 finished pathway examples with verified biochemical entities, phosphorylation events, and compartmental layouts.
Growth factor binding, receptor dimerization, Ras-GTP activation, and sequential Raf-MEK-ERK phosphorylation.
Lipid kinase activation, PIP3 generation, PTEN negative regulation, and downstream mTORC1 anabolic growth control.
7TM receptor conformational switch, heterotrimeric G-protein dissociation, cAMP generation, and CREB transcription.
Cytokine receptor activation, JAK trans-phosphorylation, STAT dimerization, nuclear import, and SOCS feedback.
Wnt ligand engagement, Frizzled-LRP co-receptors, destruction complex disassembly, and beta-catenin nuclear accumulation.
PAMP recognition, MyD88-TRAF6 adapter recruitment, IKK complex activation, IkB-alpha degradation, and NF-kB translocation.
SciDraw can help draft a scientific visual. Check all labels, relationships, and claims against your source before use.
Workflow Need | SciDraw AI | Generic Image AI |
|---|---|---|
Biochemical Arrow Semantics | Strict differentiation between activation arrows (→) and inhibition bars (⊣). | Arrows often placed arbitrarily with ambiguous or contradictory directions. |
Cellular Compartmentalization | Clear spatial boundaries: extracellular matrix, plasma membrane, cytoplasm, and nucleus. | Molecules float without anatomical compartments or membrane context. |
Editable Labels & Formats | Export layered SVG and PPTX with individually editable text labels. | Flattened raster pixels; labels cannot be corrected or translated. |
Journal-Ready Resolution | Export format and resolution depend on the figure and plan. Check the final file against the destination journal’s current requirements. | Low-resolution raster outputs that require third-party upscaling. |
Follow proven scientific visualization principles to ensure your pathway diagrams are accurate, legible, and compliant with journal requirements.
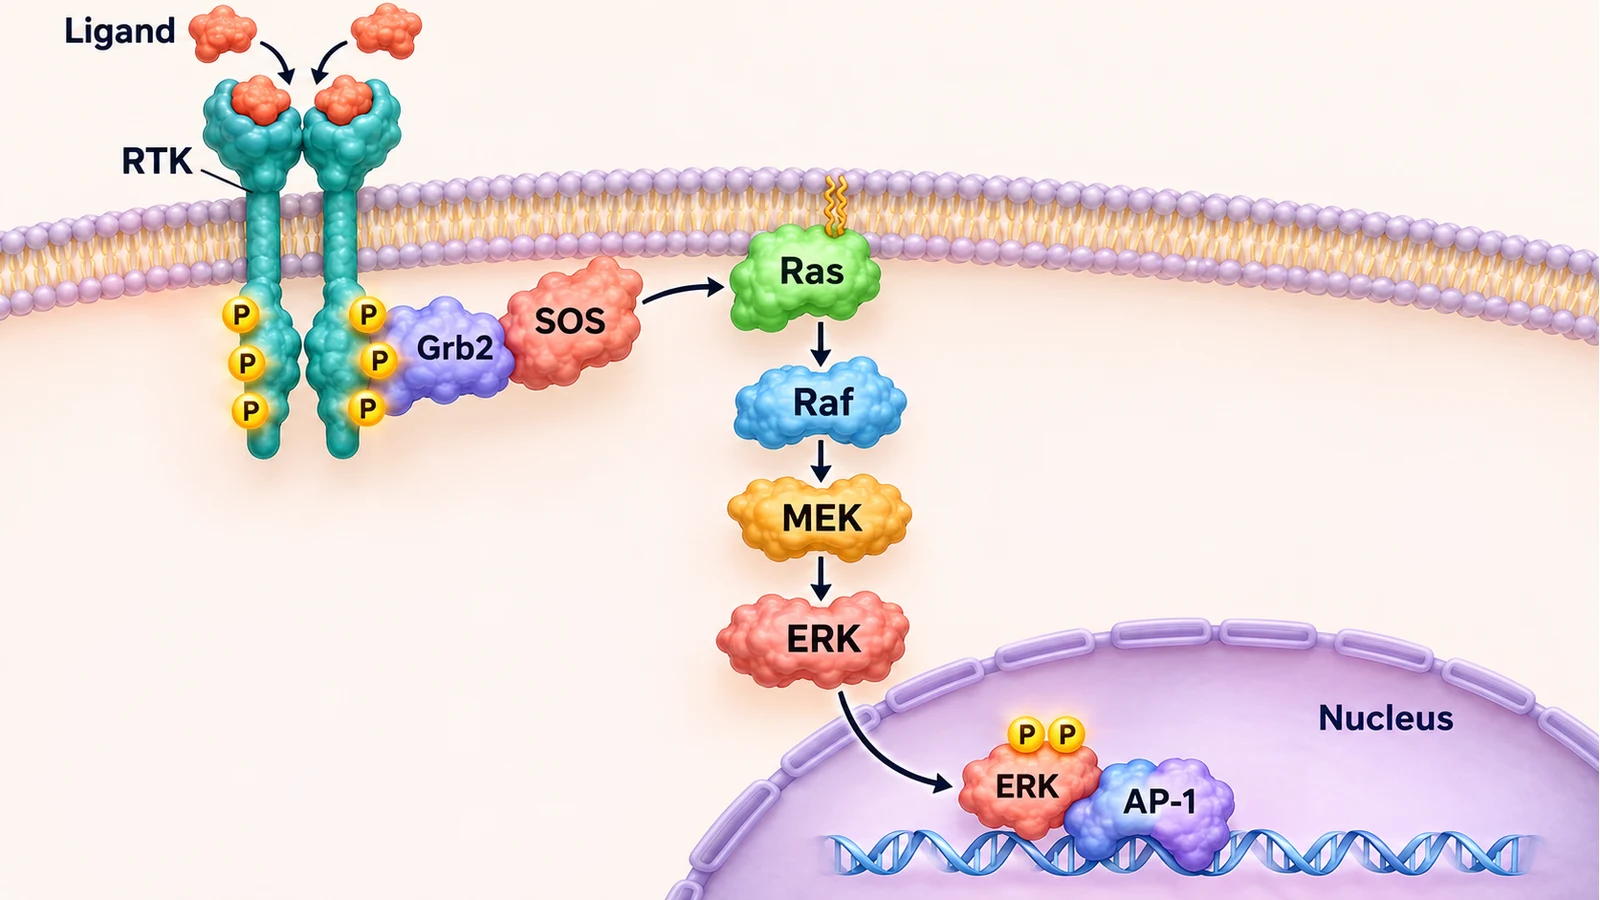
A high-impact signaling pathway figure guides the reader through chronological molecular events. Begin with extracellular ligands or stimuli at the top or left, position transmembrane receptors within a lipid bilayer, show intermediate kinase phosphorylation cascades in the cytoplasm, and place target gene transcription inside the nucleus.
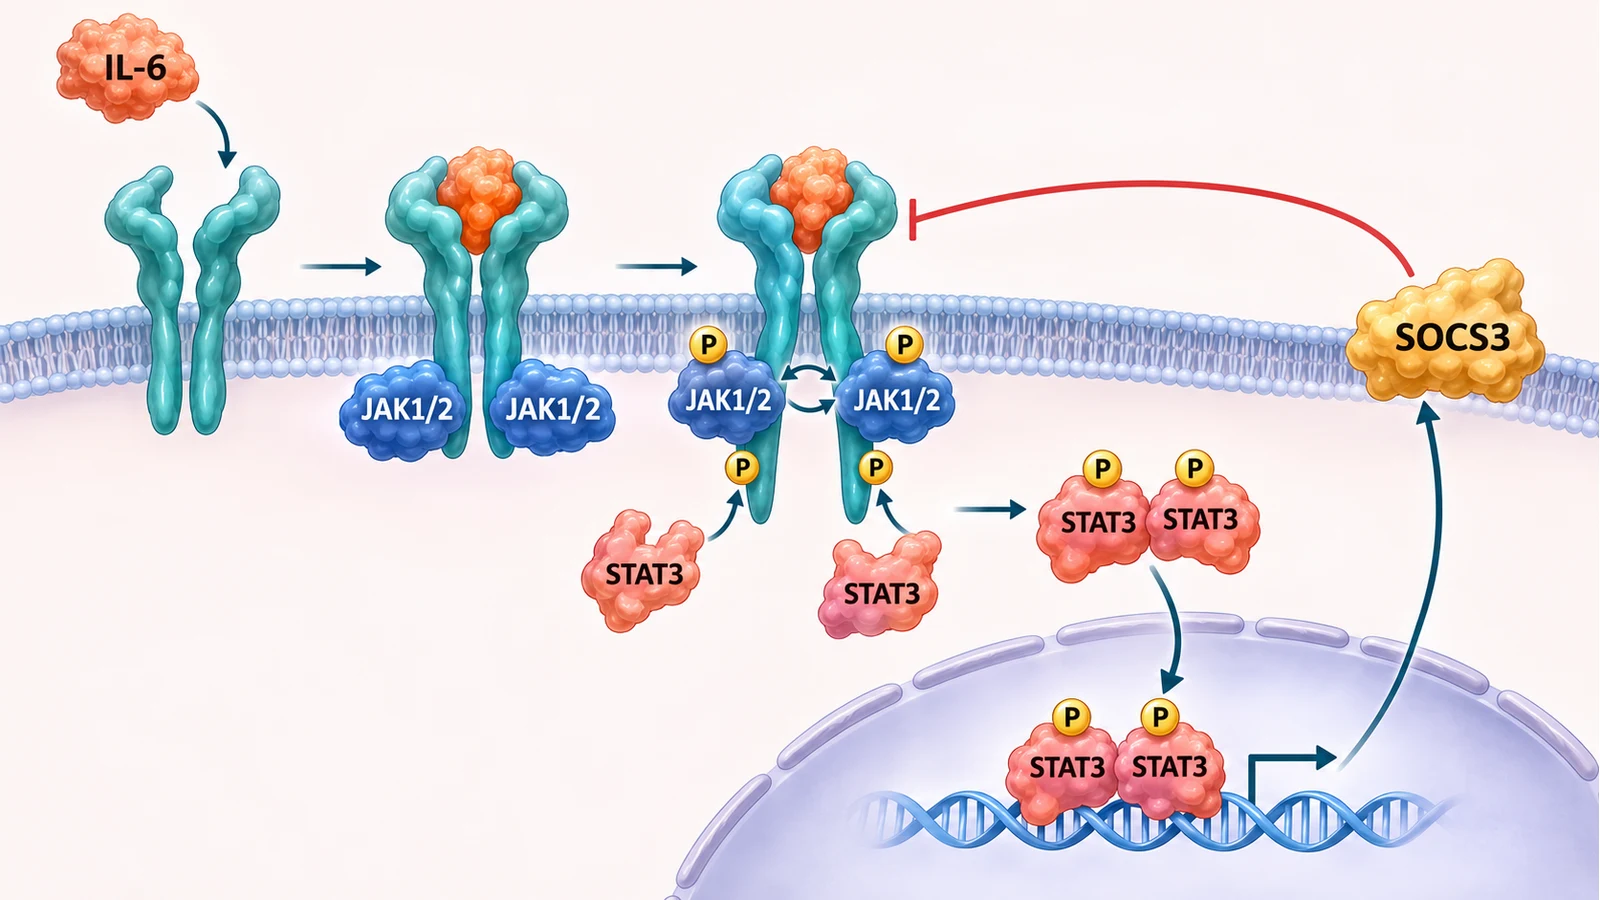
Signaling diagrams become uninterpretable when ambiguous connectors are used. Always distinguish directional activation (pointed arrowheads) from enzymatic inhibition or receptor antagonism (perpendicular crossbars). When feedback loops occur, use dashed lines to highlight regulatory recurrence.
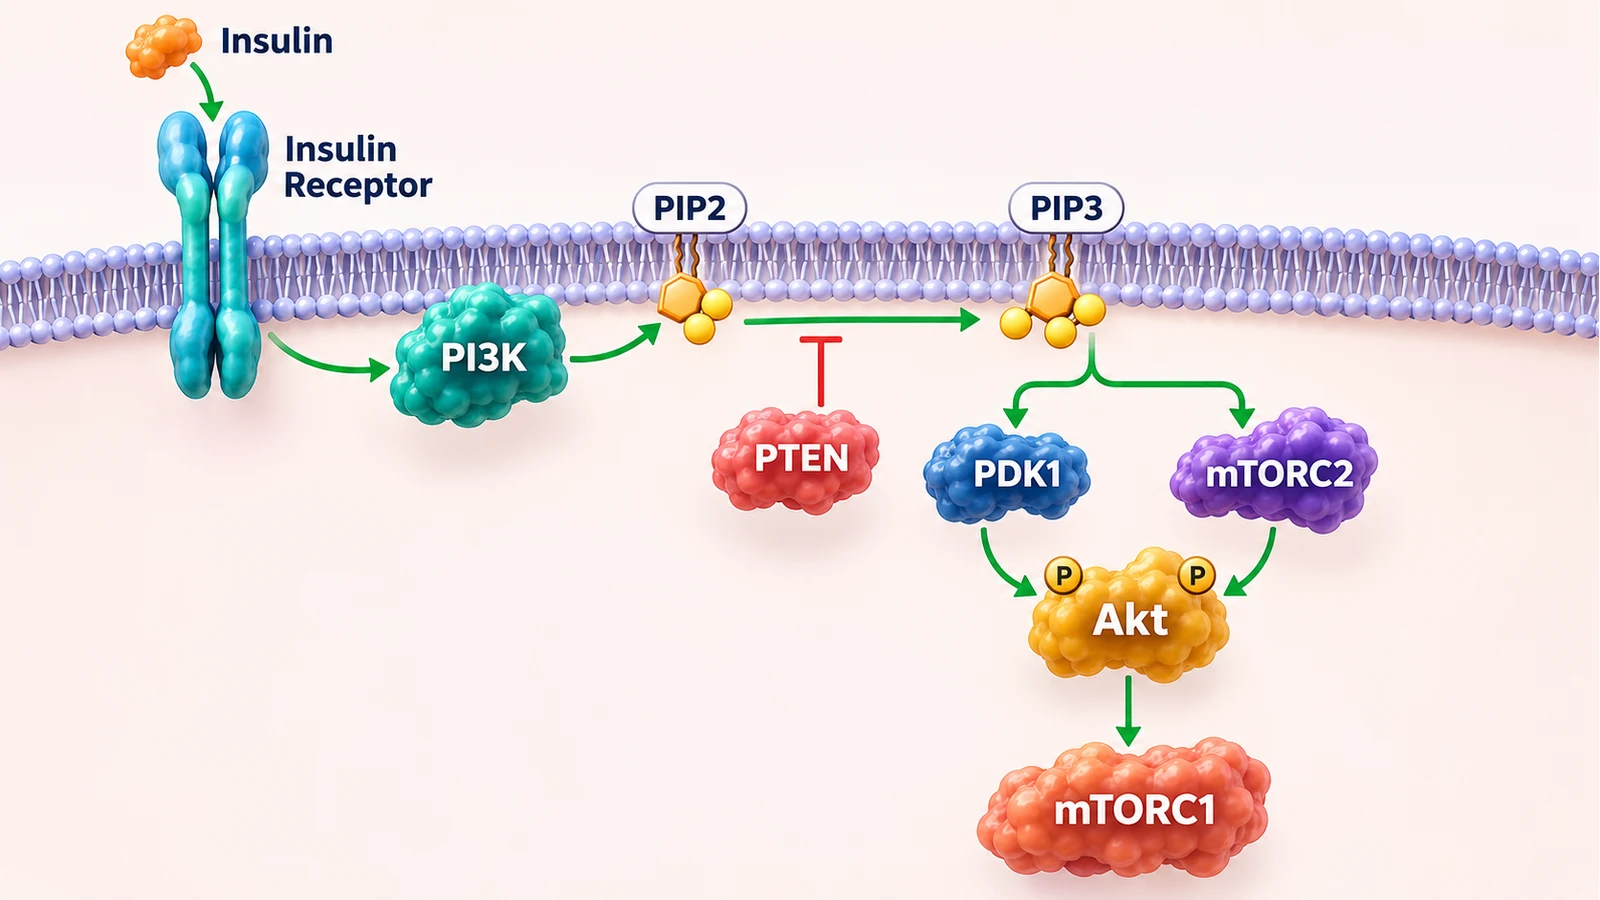
Peer reviewers look for specific biochemical markers rather than generic circles. Detail relevant phosphorylation residues (such as Tyr705 on STAT3 or Ser473 on Akt), cofactor binding (GTP vs GDP), and protein-protein dimerization events to validate the biological mechanism.
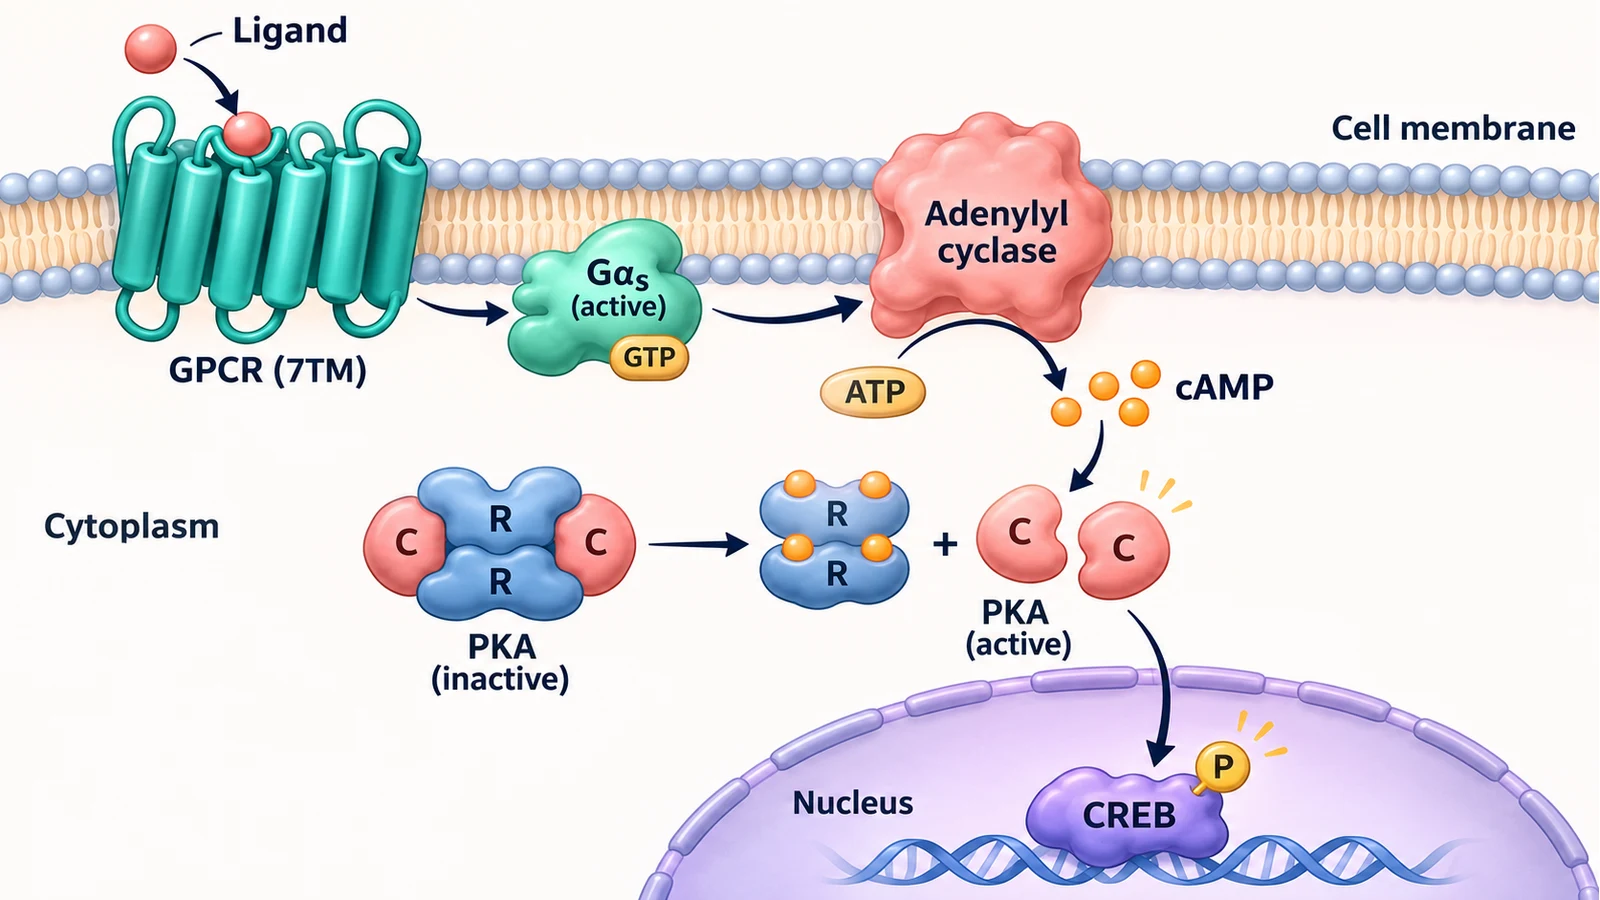
Figures submitted to Cell, Nature, or Science must remain legible when scaled down to single-column (85 mm) or double-column (175 mm) widths. Maintain minimum font sizes of 7–8 pt at final print scale and avoid decorative drop shadows or illegible script fonts.
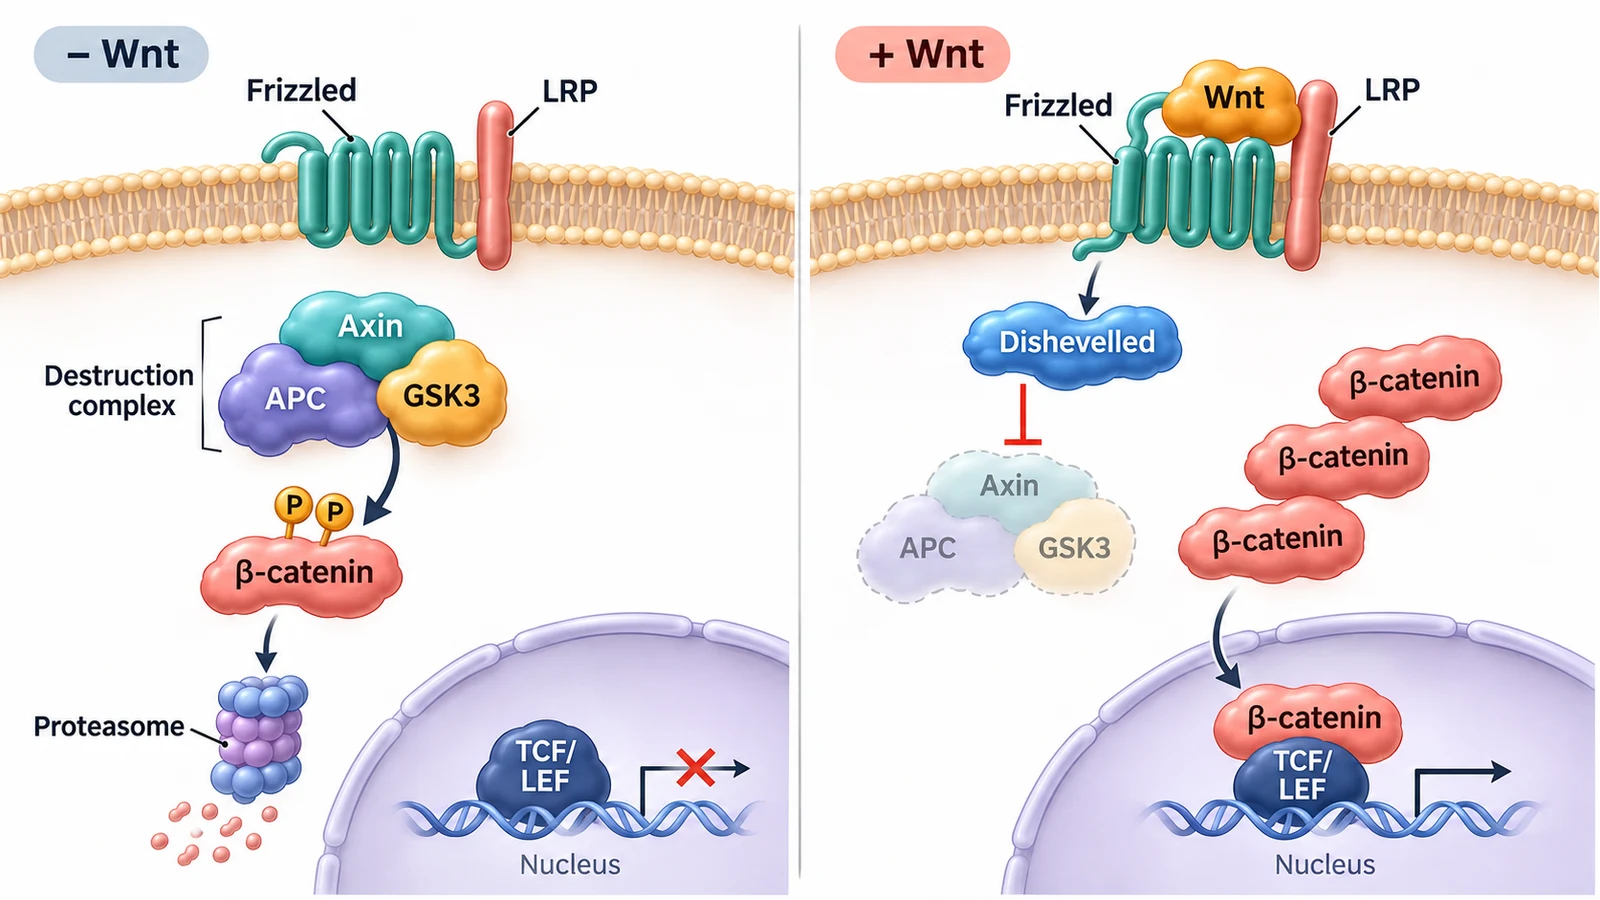
AI-generated pathway diagrams serve as structured visual drafts. Authors must carefully cross-reference all depicted interactions against empirical literature, ensuring that no speculative branches or unsupported cross-talk are presented as confirmed findings.
Choose your plan. No hidden fees, cancel anytime.
Your data is yours · Never used to train any model · Encrypted in transit and at rest
Great for getting started
Includes
Best for regular creation
Includes
Built for high-volume production
Includes









Researchers, graduate students, and educators share how SciDraw helps them create scientific figures, scientific diagrams, graphical abstracts, and clearer teaching visuals faster.
For a plant-cell lecture, I needed the chloroplasts and vacuole called out without rebuilding an old slide. SciDraw gave me a useful scientific figure layout that went into my slide deck after only a few label edits.

Dr. Helen Vance
Cell Biology Professor
When a student asks for a force-diagram example beyond the textbook, I open SciDraw instead of redrawing one on a slide. It is the scientific diagram generator I reach for first, then I quickly check every vector.

Dr. Javier Ortega
Physics Instructor
For grant proposals, we use SciDraw to agree on the experimental setup diagram before anyone starts polishing the scientific figure. It has cut down the back-and-forth and given the team a shared visual from day one.

Dr. Devendra Verma
Research Lab Director
I can compare a few biological pathway diagrams for study notes before I settle on one.

Minh Nguyen
Graduate Science Student
For my dissertation, I start the manuscript-to-figure process with neural-pathway and synapse layouts in SciDraw. It gives me a strong first composition, so I can spend Illustrator time on the details that matter.

Dr. Ananya Rao
PhD Candidate · Neuroscience
The first scientific drawing got our fractional-distillation design review moving right away.

Dr. Marcus Davis
Chemical Engineering Lead
If the stock image does not match that week’s climate topic, I make a quick diagram in SciDraw. It gives the class a visual that fits the discussion, and I can tailor the labels to their level.

Prof. Mei-Ling Zhao
Environmental Science Educator
I see authors use a scientific figure generator to turn a rough outline into something reviewers can actually read. It makes the first review conversation clearer and helps the science stand out from the layout.

Dr. Thomas Ødegård
Scientific Journal Editor
For tectonics classes, I use a custom volcano cross-section diagram when the stock image does not match the boundary we are discussing. Students grasp the process much faster when the visual follows the exact example.

Dr. Fatima Al-Sayed
Geology Lecturer
It gives me a tidy scientific figure draft for a force diagram or wave sketch quickly, without making the curriculum page feel crowded.

Dr. Nathan Brooks
STEM Developer
I place a simple materials-science diagram next to SEM images so students can connect an ideal lattice to the real sample. That visual comparison makes the lesson click much faster than another paragraph of explanation.

Dr. Clara Sommer
Materials Researcher
Before opening CAD, we use SciDraw’s architecture diagram generator to make the system boundary and handoffs visible. It gets the right questions onto the table early and helps the team align before detailed modeling.

Dr. Robert Söderberg
Mechanical Engineer
For photosynthesis slides, I start with a chloroplast scientific figure that I can tailor to the level of the class. It saves a surprising amount of preparation time when a lesson needs a fresh visual.

Dr. Hannah Weber
Plant Biology Researcher
It gets me past the blank page on a science explainer and gives the final illustration a clearer direction.

Ji-Min Kim
Scientific Content Creator
Having students create a scientific drawing for a lab report makes them think through the process step by step. The discussion and revision afterwards are noticeably stronger.

Dr. Sofia Alvarez
Biochemistry Professor
It is helpful when we need an astronomy diagram for the exact orbit or instrument configuration in the discussion, rather than a generic solar-system graphic. The result feels much closer to the research question.

Dr. David Park
Astronomical Researcher
A labeled ecology figure gives our postdoc meetings something concrete to point at when we discuss feedback loops. It keeps the discussion focused and helps us reach a paper figure faster.

Dr. Lisa Wang
Ecology Postdoc
For multi-panel papers, I use the manuscript-to-figure workflow to decide what each panel needs to do before Illustrator. It makes the first layout decisions faster and leaves more time for the final polish.

Carlos Ortega
Illustrator Assistant
For early circuit and network reviews, I use SciDraw’s architecture diagram generator to get a first pass on the page. The team can mark it up together instead of building slides from fragments, which makes decisions quicker.

Dr. Elena Gomez
Systems Engineering Lead
For public-facing science guides, clear scientific diagrams often travel better than a dense block of text. They make complex ideas easier to share across languages and give us a strong starting point for the final guide.

Dr. Michael Achebe
Science Communicator
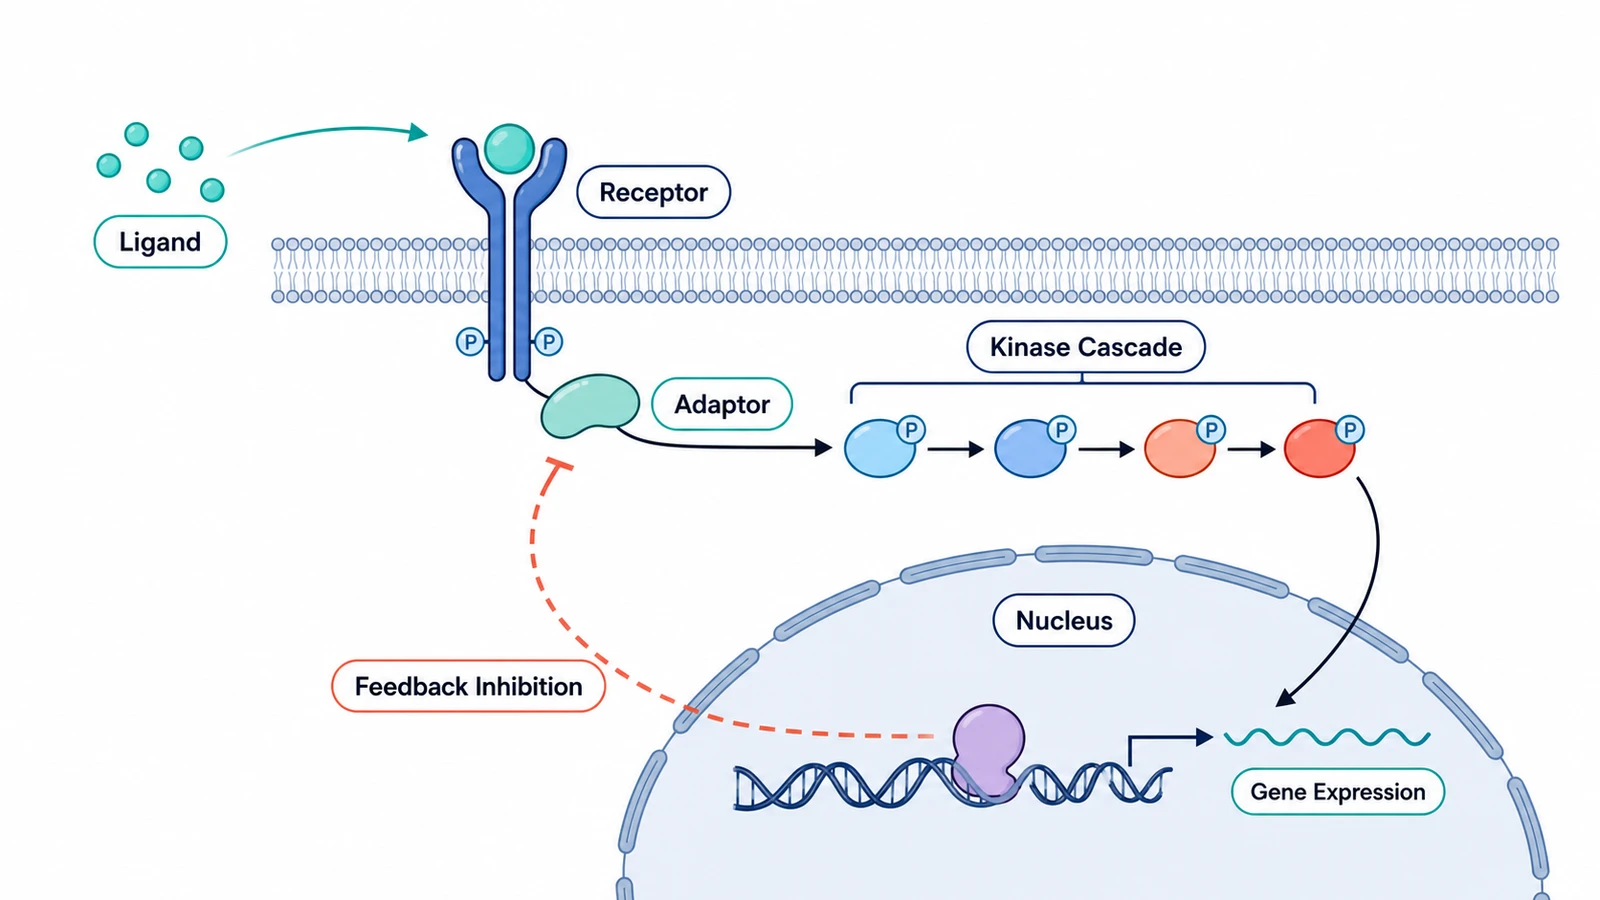 Biology
Create focused signaling, metabolism, regulation, and molecular interaction diagrams.
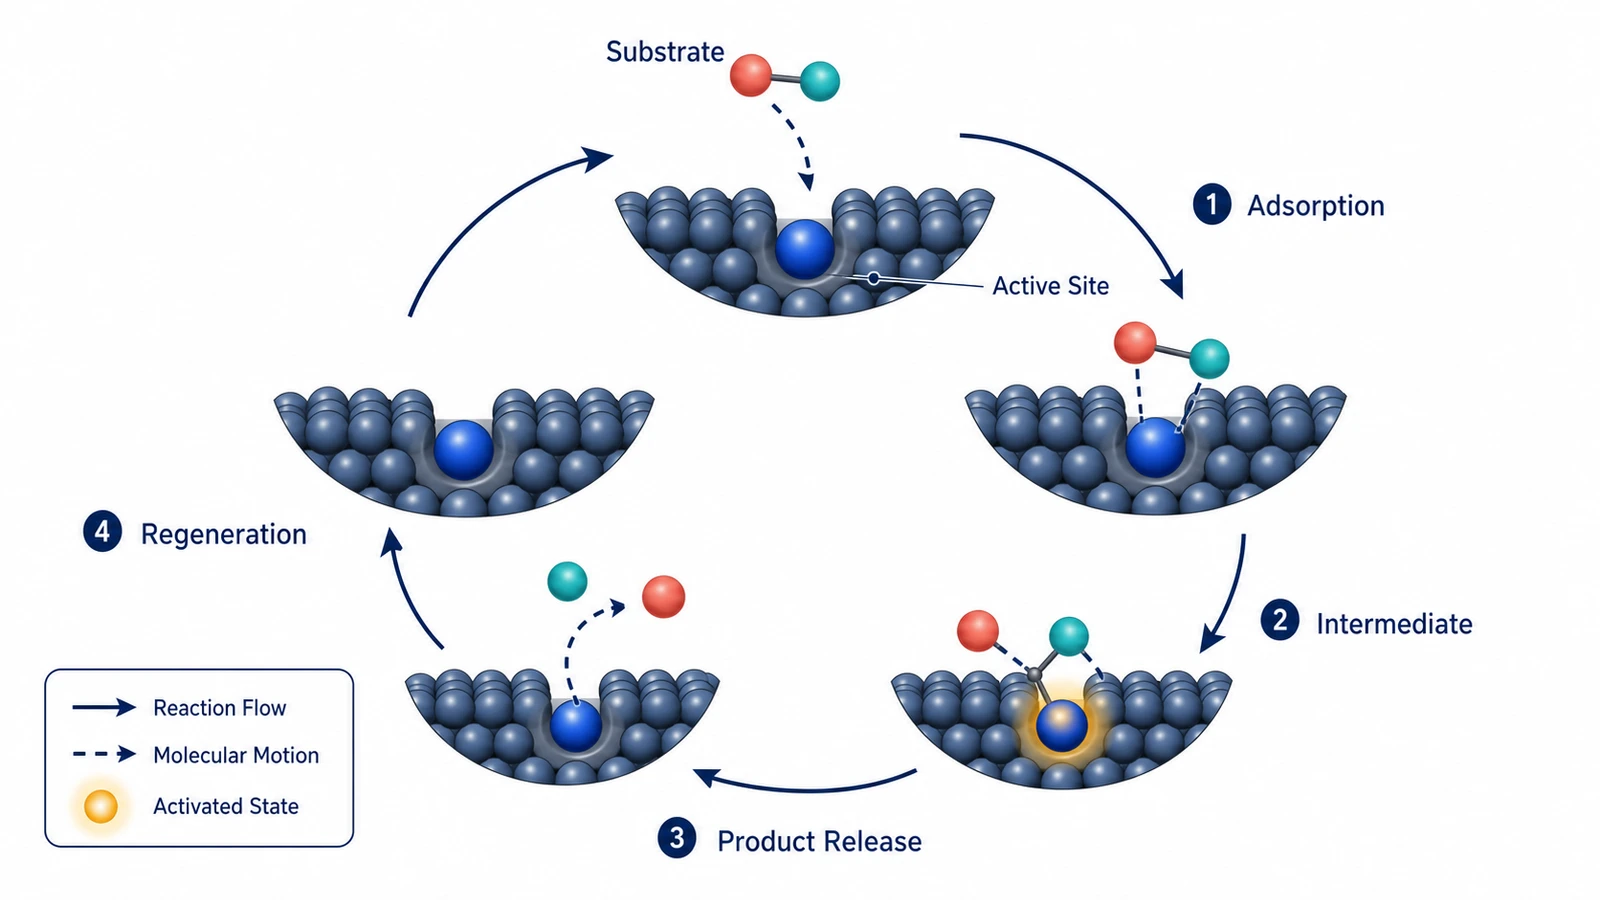 Biology
Create pathway, process, and causal mechanism diagrams with clear English labels.
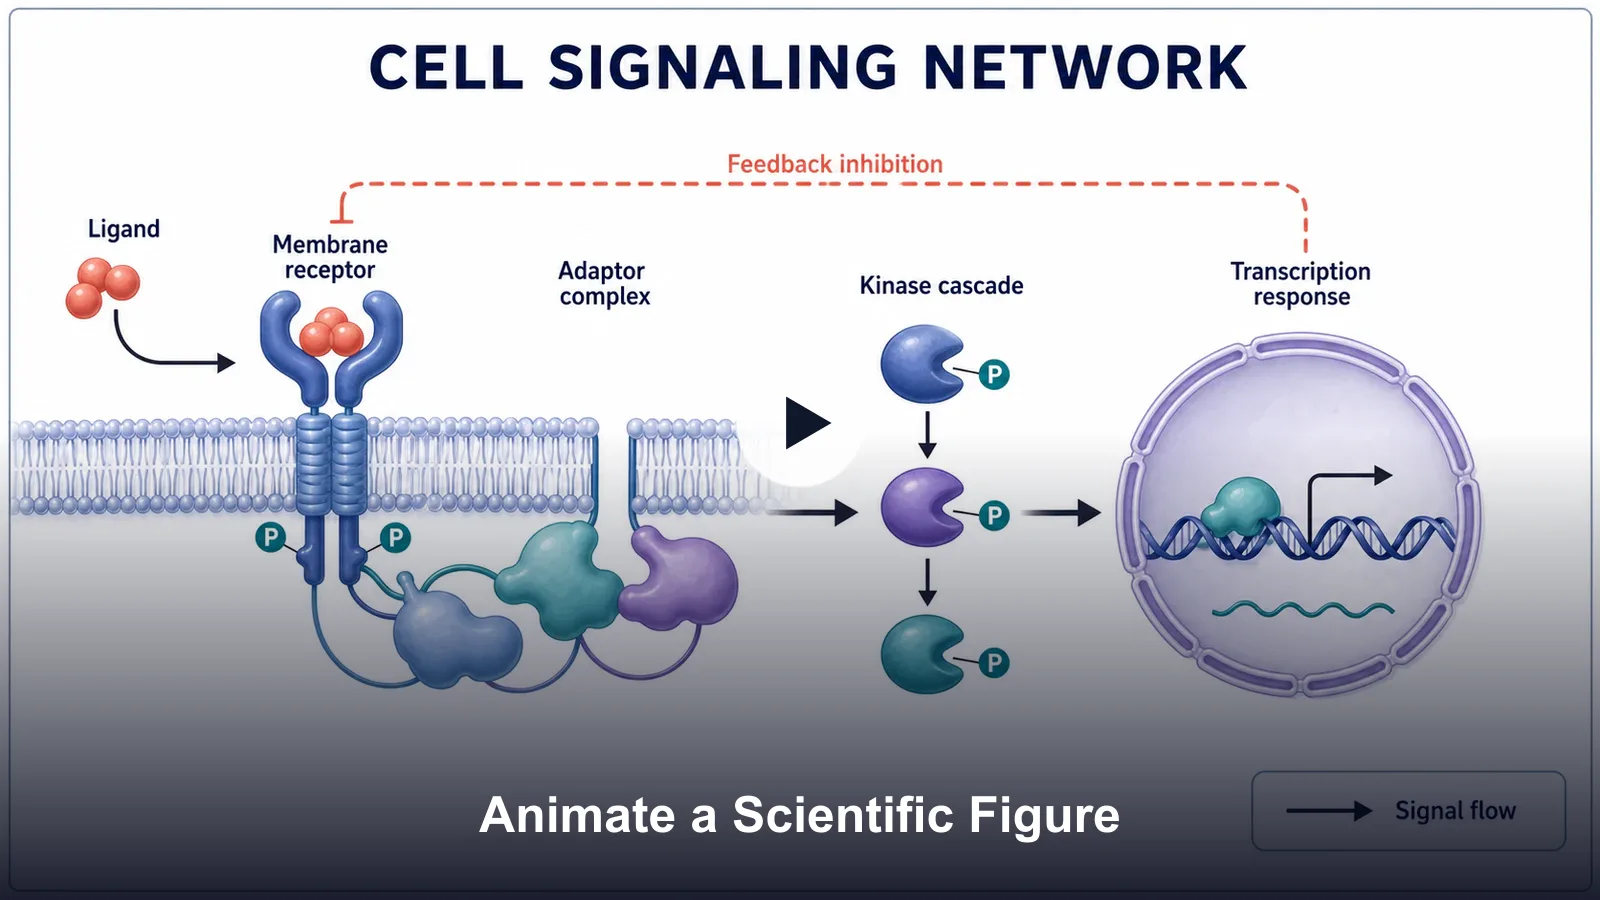 Research
Turn static signaling pathways into short motion drafts following your depicted cascade.