
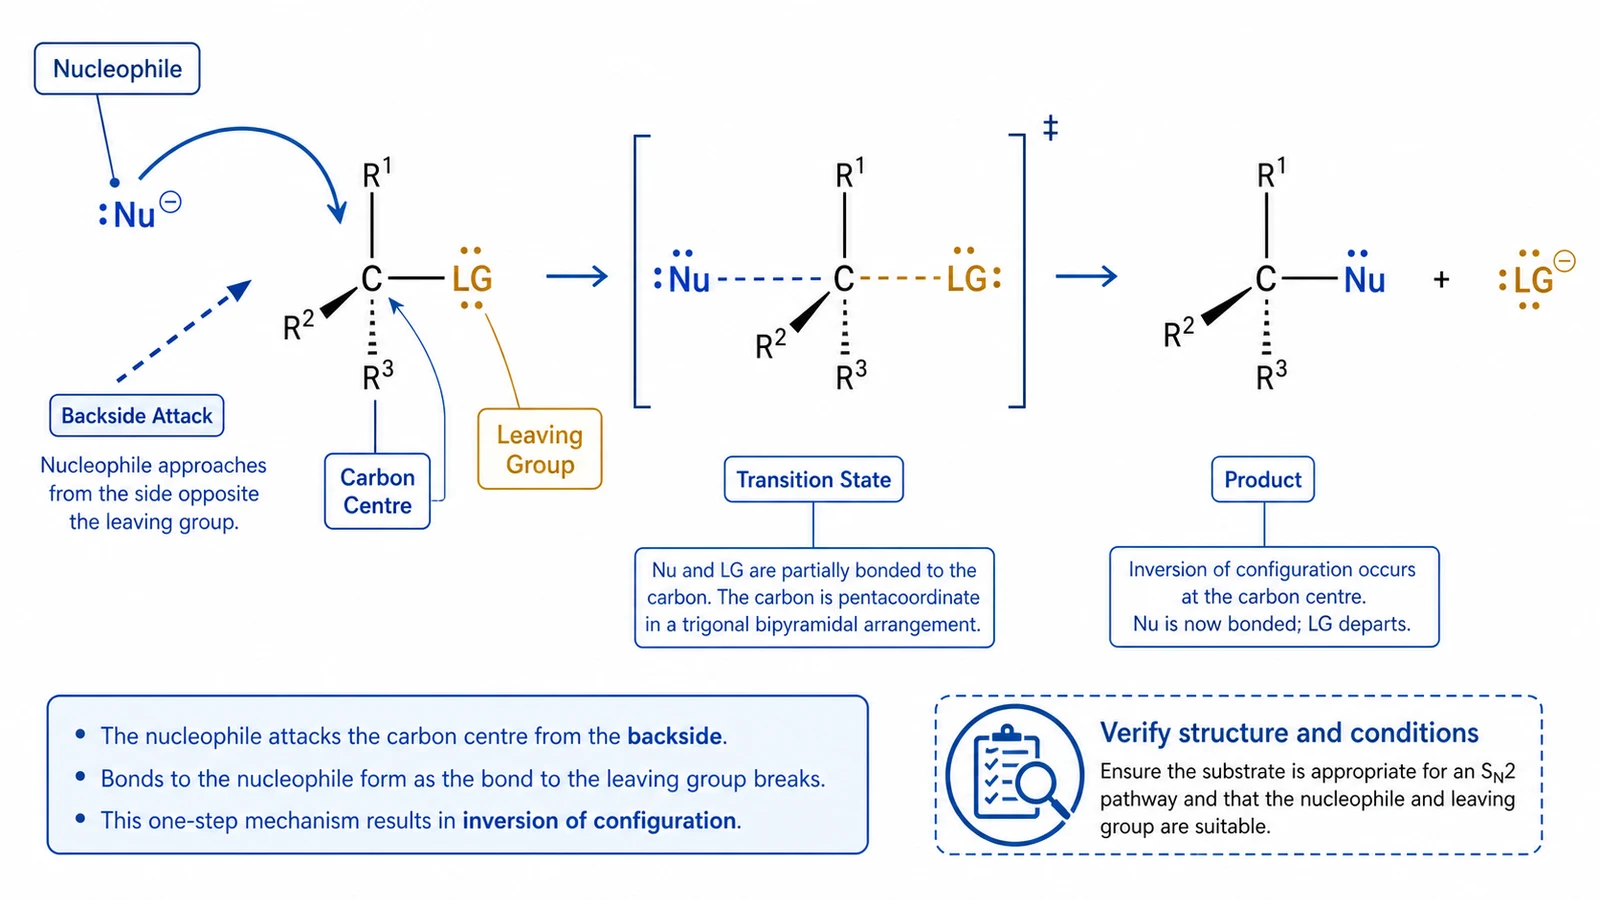
SN2 substitution concept
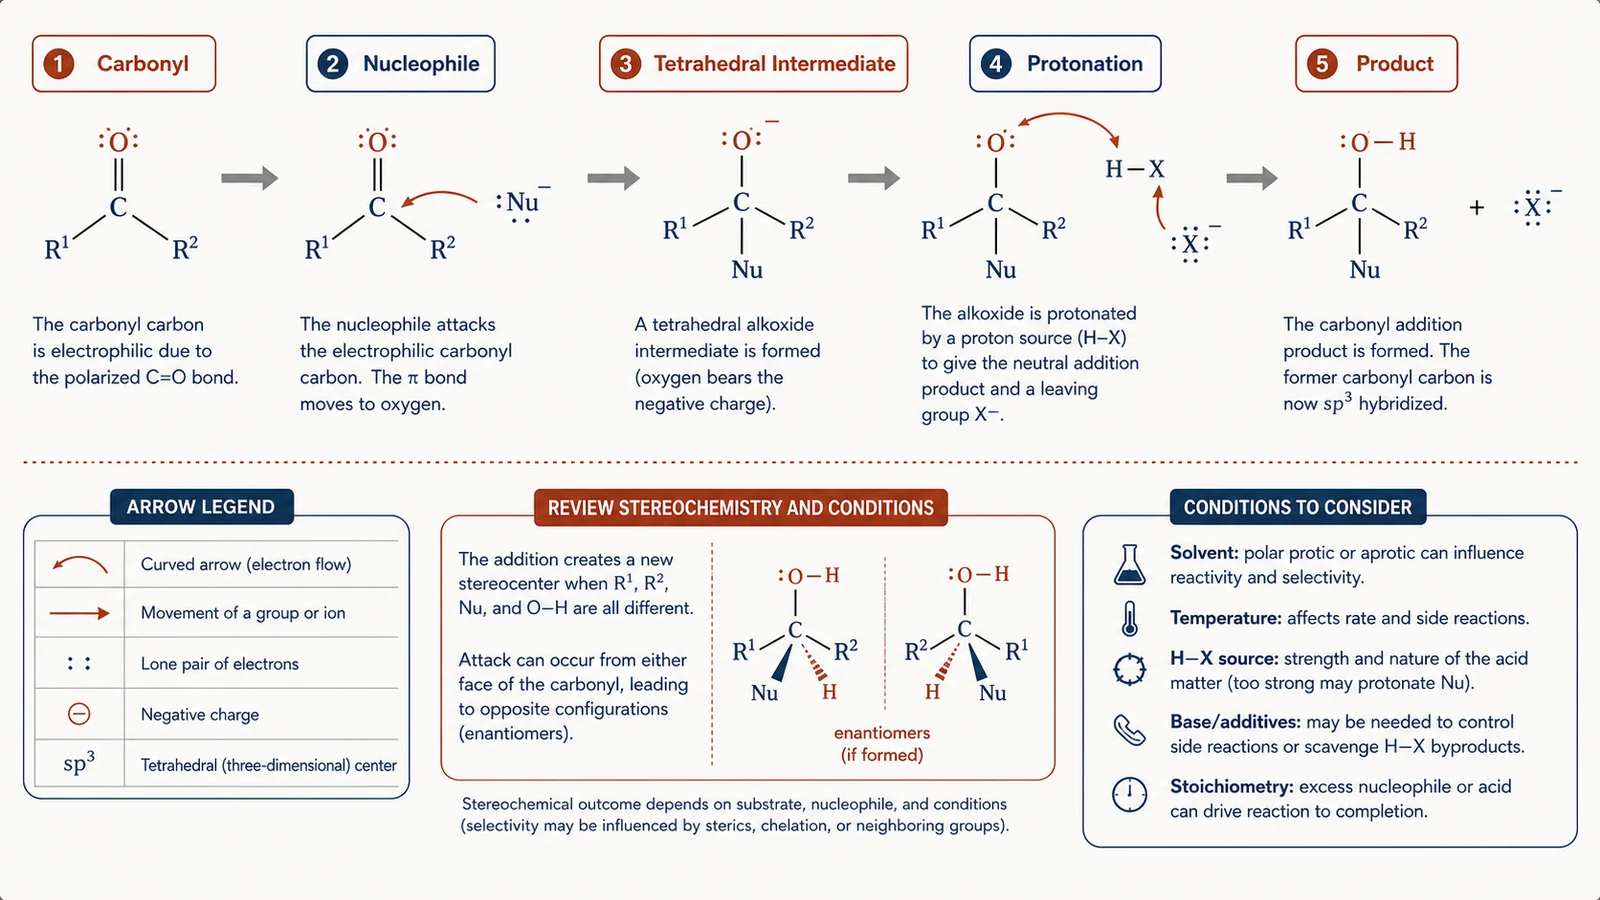
A compact arrow-pushing layout that keeps the proposed path and chemistry review note visible.
Organic chemistry
Use the Reaction Mechanism Generator to create readable reaction-mechanism diagrams with generic structures, curved arrows, intermediates, and review notes. Use the result to communicate a proposed pathway, then verify every structure, arrow, condition, and product against authoritative chemistry sources and your experimental context.
Free to try ·
Your diagram will appear here
Describe what you need and click Generate
Move from a focused brief to a structured draft with the Reaction Mechanism Generator workflow, then refine the details your audience needs. SciDraw helps you organize the visual before you use it in research communication, teaching, or project review.
State what the visual should explain, who will read it, and which labels, relationships, or stages must be visible.
Use a focused prompt or reference to organize the visual around the most relevant details, such as SN2 substitution concept and Acid-base proton transfer.
Check terminology, arrows, object identity, layout, and unsupported claims against the source material before exporting or presenting the draft.
State what the visual should explain, who will read it, and which labels, relationships, or stages must be visible.
Use a focused prompt or reference to organize the visual around the most relevant details, such as SN2 substitution concept and Acid-base proton transfer.
Check terminology, arrows, object identity, layout, and unsupported claims against the source material before exporting or presenting the draft.
Six independent mechanism concepts illustrate visual conventions and reviewable layouts. They are communication drafts, not verified reaction predictions or experimental instructions.
A compact arrow-pushing layout that keeps the proposed path and chemistry review note visible.
A simple proton-transfer visual that separates arrow notation from any claim about a specific system.
A reviewable mechanism layout for explaining a generalized addition pathway.
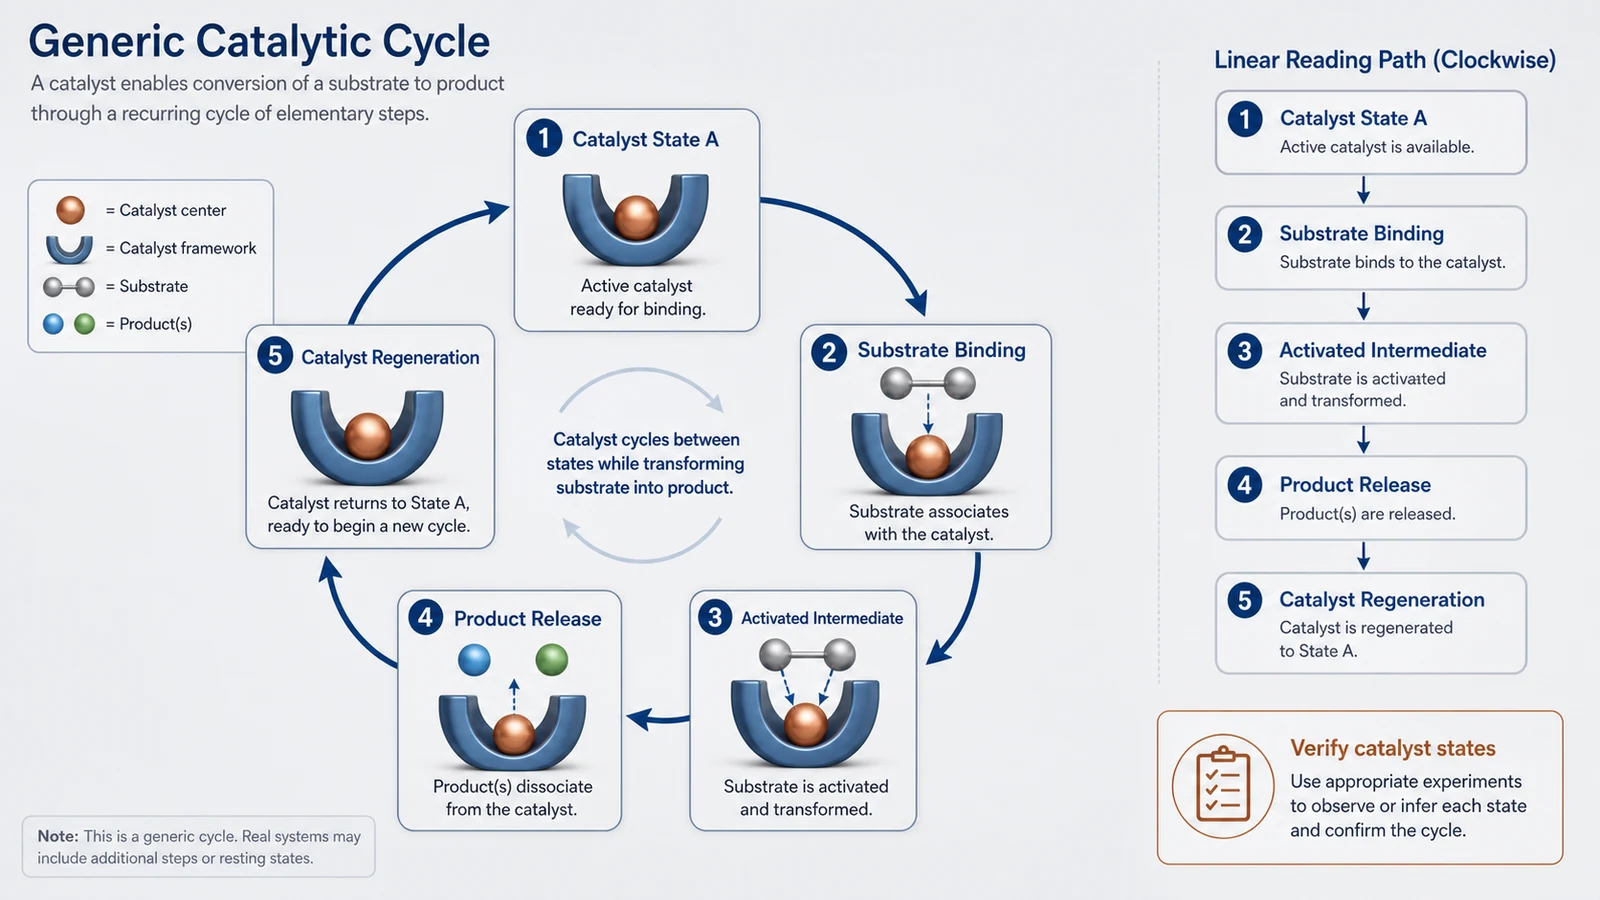
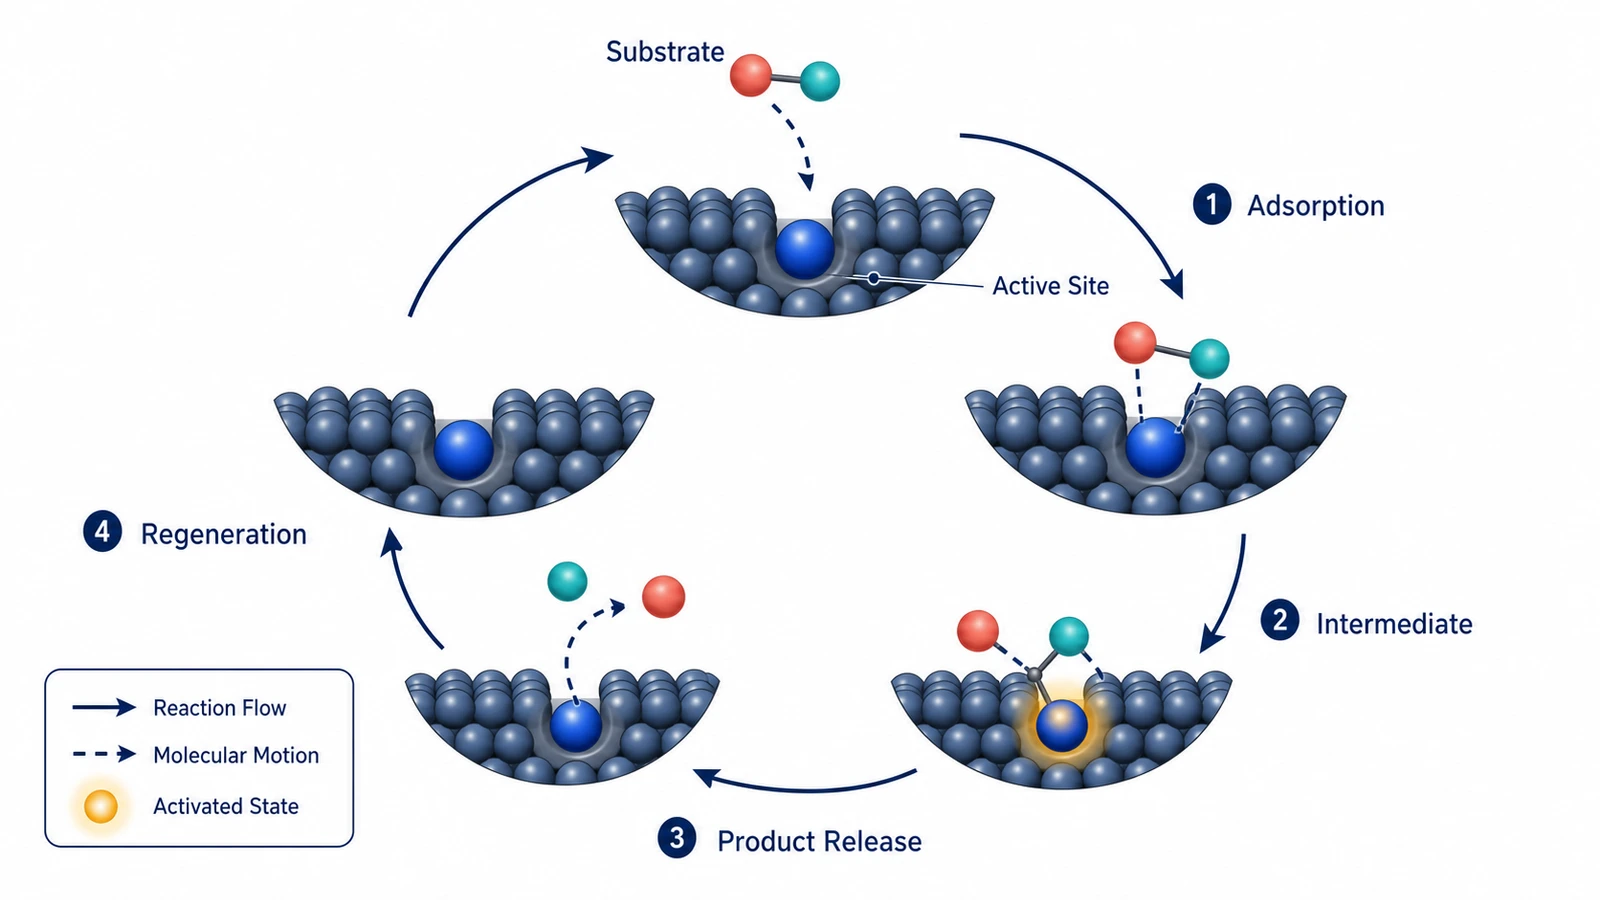
A cycle layout for discussing states and hand-offs without fabricating conditions or selectivity.
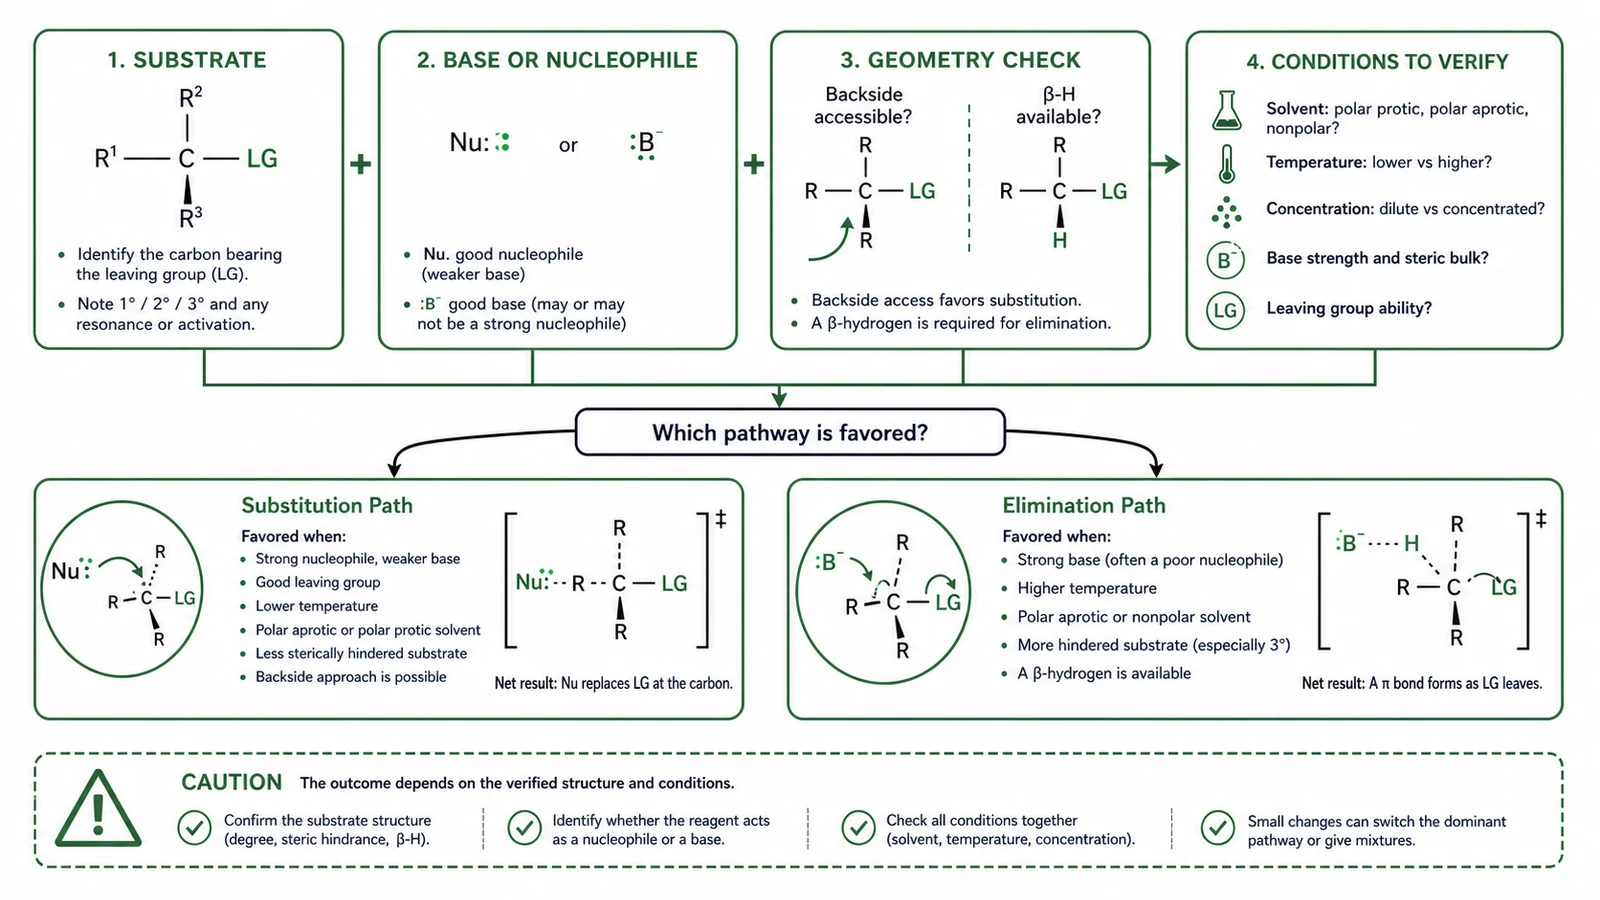
A comparison framework that leaves reaction selection to a chemistry expert.
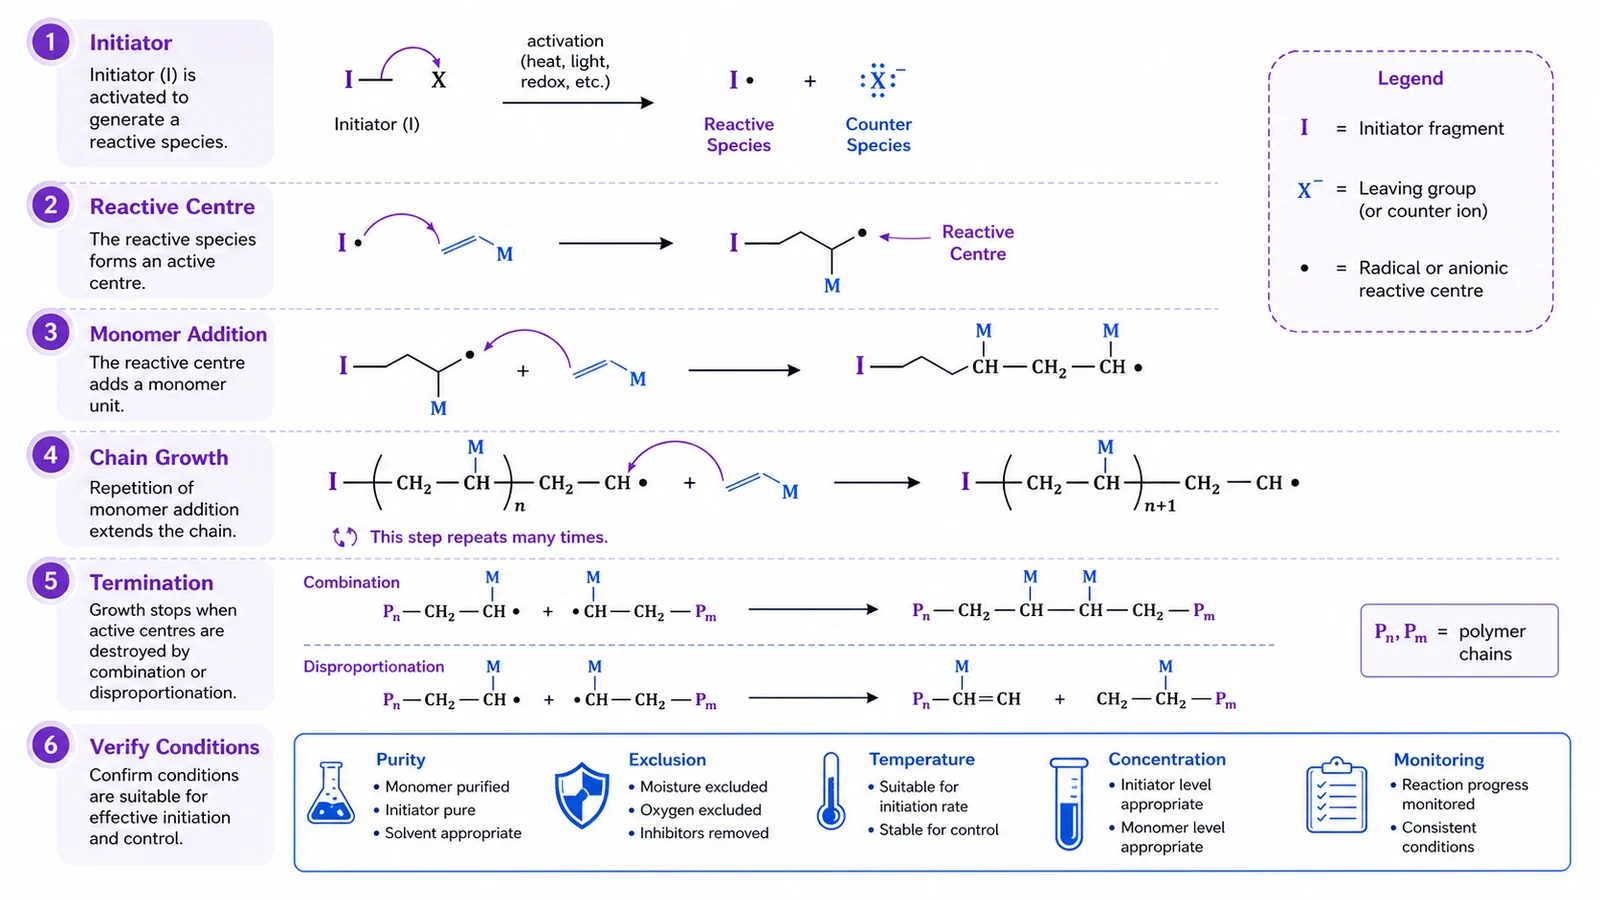
A high-level chain-growth explanation with stages that require source and condition review.
SciDraw combines a focused Reaction Mechanism Generator workflow with structured prompts, relevant examples, and a review step. That keeps the page useful for planning and refinement instead of treating a scientific visual as decoration.
Workflow need | SciDraw | Generic image tools |
|---|---|---|
Clear visual intent | Start with a focused brief and a defined audience. | The prompt may focus on appearance without a review goal. |
Scientific structure | Describe labels, relationships, stages, boundaries, and flow explicitly. | Connections and hierarchy may be inferred or left ambiguous. |
Reviewable iteration | Refine the visual against its source material and review criteria before sharing. | A visual may need to be rebuilt in another workflow after generation. |
Audience-aware output | Adapt density, labels, framing, and reading order for papers, talks, teaching, or planning. | One generic composition may not fit the intended audience. |
Use the guidance below to turn Reaction Mechanism Generator briefs into clearer scientific visuals, check their meaning, and prepare the next revision with confidence.
A useful mechanism figure makes the proposed order of electron movement, intermediate states, catalyst role, and uncertainty legible. It does not replace a source-backed chemical rationale.
Mechanism diagrams can look authoritative even when the chemistry is incomplete. Check the structures, stoichiometry, charge, atom balance, stereochemistry, conditions, literature support, and feasibility before sharing or acting on a draft.
Provide only source-backed reaction context and specify what should remain conceptual. Ask for labels, a legend, and a review flag rather than invented intermediates or unreported conditions.
Keep reaction conditions and supporting evidence in distinct visual zones. This lets readers see what is observed, what is inferred, and what still needs validation.
Use this page for electron-flow or catalytic pathway drafts. Use a mechanism diagram for cross-domain processes, a materials figure for characterization narratives, and a graphical abstract for a study-level story.
Choose your plan. No hidden fees, cancel anytime.
Your data is yours · Never used to train any model · Encrypted in transit and at rest
Great for getting started
Includes
Best for regular creation
Includes
Built for high-volume production
Includes









Researchers, graduate students, and educators share how SciDraw helps them create scientific figures, scientific diagrams, graphical abstracts, and clearer teaching visuals faster.
For a plant-cell lecture, I needed the chloroplasts and vacuole called out without rebuilding an old slide. SciDraw gave me a useful scientific figure layout that went into my slide deck after only a few label edits.

Dr. Helen Vance
Cell Biology Professor
When a student asks for a force-diagram example beyond the textbook, I open SciDraw instead of redrawing one on a slide. It is the scientific diagram generator I reach for first, then I quickly check every vector.

Dr. Javier Ortega
Physics Instructor
For grant proposals, we use SciDraw to agree on the experimental setup diagram before anyone starts polishing the scientific figure. It has cut down the back-and-forth and given the team a shared visual from day one.

Dr. Devendra Verma
Research Lab Director
I can compare a few biological pathway diagrams for study notes before I settle on one.

Minh Nguyen
Graduate Science Student
For my dissertation, I start the manuscript-to-figure process with neural-pathway and synapse layouts in SciDraw. It gives me a strong first composition, so I can spend Illustrator time on the details that matter.

Dr. Ananya Rao
PhD Candidate · Neuroscience
The first scientific drawing got our fractional-distillation design review moving right away.

Dr. Marcus Davis
Chemical Engineering Lead
If the stock image does not match that week’s climate topic, I make a quick diagram in SciDraw. It gives the class a visual that fits the discussion, and I can tailor the labels to their level.

Prof. Mei-Ling Zhao
Environmental Science Educator
I see authors use a scientific figure generator to turn a rough outline into something reviewers can actually read. It makes the first review conversation clearer and helps the science stand out from the layout.

Dr. Thomas Ødegård
Scientific Journal Editor
For tectonics classes, I use a custom volcano cross-section diagram when the stock image does not match the boundary we are discussing. Students grasp the process much faster when the visual follows the exact example.

Dr. Fatima Al-Sayed
Geology Lecturer
It gives me a tidy scientific figure draft for a force diagram or wave sketch quickly, without making the curriculum page feel crowded.

Dr. Nathan Brooks
STEM Developer
I place a simple materials-science diagram next to SEM images so students can connect an ideal lattice to the real sample. That visual comparison makes the lesson click much faster than another paragraph of explanation.

Dr. Clara Sommer
Materials Researcher
Before opening CAD, we use SciDraw’s architecture diagram generator to make the system boundary and handoffs visible. It gets the right questions onto the table early and helps the team align before detailed modeling.

Dr. Robert Söderberg
Mechanical Engineer
For photosynthesis slides, I start with a chloroplast scientific figure that I can tailor to the level of the class. It saves a surprising amount of preparation time when a lesson needs a fresh visual.

Dr. Hannah Weber
Plant Biology Researcher
It gets me past the blank page on a science explainer and gives the final illustration a clearer direction.

Ji-Min Kim
Scientific Content Creator
Having students create a scientific drawing for a lab report makes them think through the process step by step. The discussion and revision afterwards are noticeably stronger.

Dr. Sofia Alvarez
Biochemistry Professor
It is helpful when we need an astronomy diagram for the exact orbit or instrument configuration in the discussion, rather than a generic solar-system graphic. The result feels much closer to the research question.

Dr. David Park
Astronomical Researcher
A labeled ecology figure gives our postdoc meetings something concrete to point at when we discuss feedback loops. It keeps the discussion focused and helps us reach a paper figure faster.

Dr. Lisa Wang
Ecology Postdoc
For multi-panel papers, I use the manuscript-to-figure workflow to decide what each panel needs to do before Illustrator. It makes the first layout decisions faster and leaves more time for the final polish.

Carlos Ortega
Illustrator Assistant
For early circuit and network reviews, I use SciDraw’s architecture diagram generator to get a first pass on the page. The team can mark it up together instead of building slides from fragments, which makes decisions quicker.

Dr. Elena Gomez
Systems Engineering Lead
For public-facing science guides, clear scientific diagrams often travel better than a dense block of text. They make complex ideas easier to share across languages and give us a strong starting point for the final guide.

Dr. Michael Achebe
Science Communicator
 Research
Create mechanism diagrams for chemical reactions, biological processes, and engineering systems.
 Research
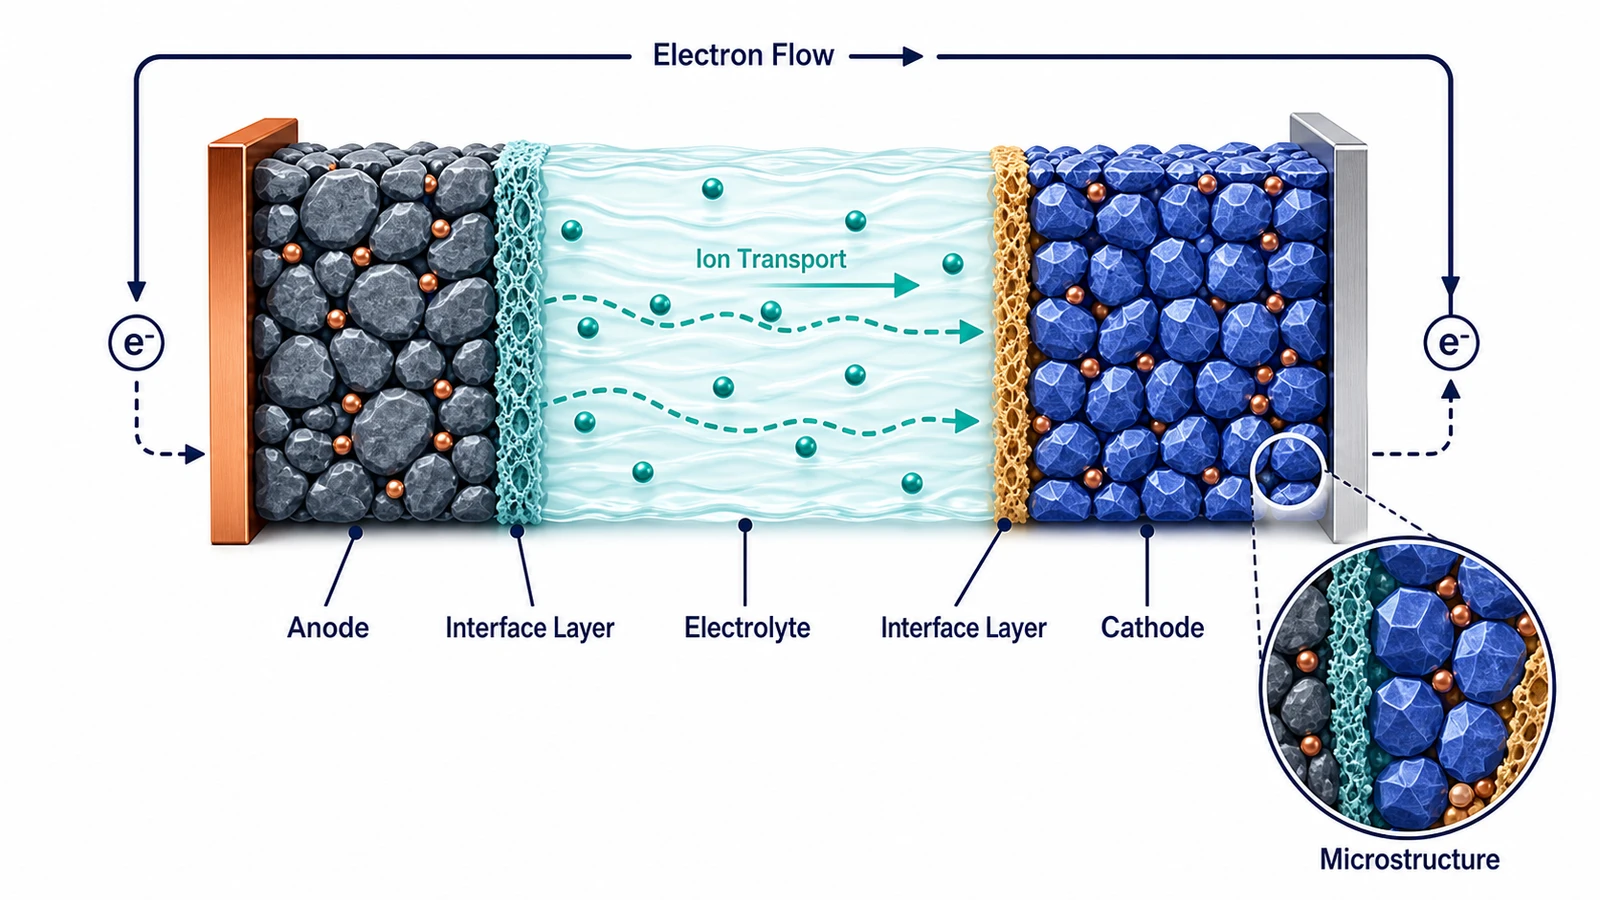
Create materials science figures for synthesis routes, characterization workflows, microstructure, and structure-property stories.
 Research
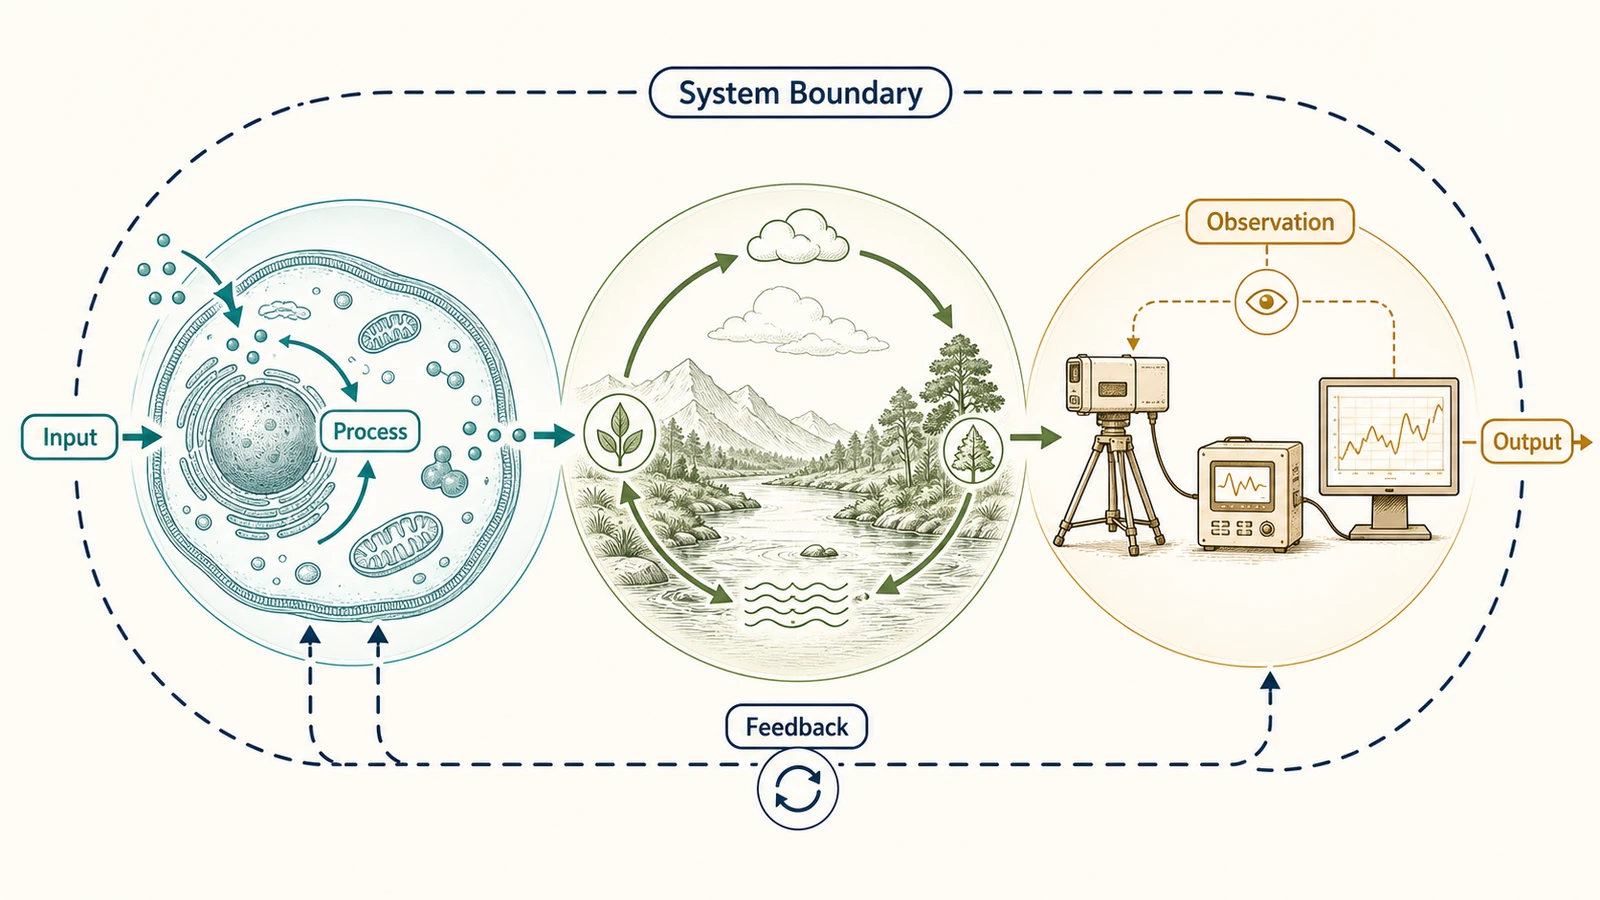
Create scientific diagrams for concepts, systems, processes, and evidence communication across research and education.