
Multi-Panel Paper Figure to Slide Objects
Dense 4-panel publication figure decomposed into individual movable slide cards for western blots, bar charts, and survival curves.
Multi-Panel
Use the Figure to PPTX Converter to create a scientific figure in SciDraw and export eligible elements to PowerPoint. Some artwork may remain as an image.
Free to try ·
Your diagram will appear here
Describe what you need and click Generate
Transform flat scientific images and PDFs into fully separated PowerPoint slides ready for conference talks, lectures, and thesis defenses.
Submit any publication figure, manuscript PDF excerpt, pathway schematic, or conference poster section in PNG, JPG, or PDF format.
SciDraw isolates discrete graphic shapes, arrows, cellular boundaries, and converts pixel labels into formatted editable PowerPoint text.
Open the downloaded file in Microsoft PowerPoint, Apple Keynote, or Google Slides to recolor, ungroup, reformat, and animate slide elements.
Submit any publication figure, manuscript PDF excerpt, pathway schematic, or conference poster section in PNG, JPG, or PDF format.
SciDraw isolates discrete graphic shapes, arrows, cellular boundaries, and converts pixel labels into formatted editable PowerPoint text.
Open the downloaded file in Microsoft PowerPoint, Apple Keynote, or Google Slides to recolor, ungroup, reformat, and animate slide elements.
Explore scientific figure conversions featuring ungrouped vector shapes, isolated typography, re-spaced 16:9 widescreen layouts, and customizable slide themes.
Dense 4-panel publication figure decomposed into individual movable slide cards for western blots, bar charts, and survival curves.
Signaling cascade converted into ungroupable vector proteins with editable text boxes for modifying gene symbols and phosphorylation states.
Sequential laboratory schedule reorganized into movable milestone cards with adjustable dates, icons, and assay descriptions.
Complex anatomical illustration separated into distinct vector layers for effortless recoloring to match dark or light slide templates.
Narrow journal figure re-spaced and enlarged for auditorium legibility with 24pt presentation typography on 16:9 widescreen canvas.
Laboratory equipment schematic decomposed into independent vector groups for culture flasks, centrifuges, and multi-well plates.
PowerPoint export is available for eligible SciDraw figures. Conversion support and editability depend on the figure and the editor workflow.
Workflow Need | SciDraw AI | Generic Image AI |
|---|---|---|
Ungroupable Native Vector Shapes | Converts flat raster illustrations into genuine Microsoft Office shapes that you can ungroup, recolor, scale, and adjust without pixelation. | Inserts a single flattened bitmap image that cannot be ungrouped or recolored in PowerPoint. |
Fully Editable Typography & Fonts | Recognizes text and converts labels into native PowerPoint text boxes with matched font weights, preventing embarrassing OCR typos. | Bakes text into background pixels, preventing font changes or terminology updates. |
Optimized for 16:9 Widescreen Slides | Automatically re-spaces single-column or multi-panel journal layouts into clean, auditorium-legible widescreen slide presentations. | Stretches or crops multi-panel figures awkwardly when placed on 16:9 widescreen slides. |
Commercial & Conference Presentation License | Full commercial ownership with zero watermarks, perfectly suited for keynote speeches, defense presentations, and lecture slides. | Requires manual tracing in third-party vector software before seminar or conference use. |
Follow proven scientific visualization principles to ensure your diagrams are accurate, legible, and aligned with journal requirements.
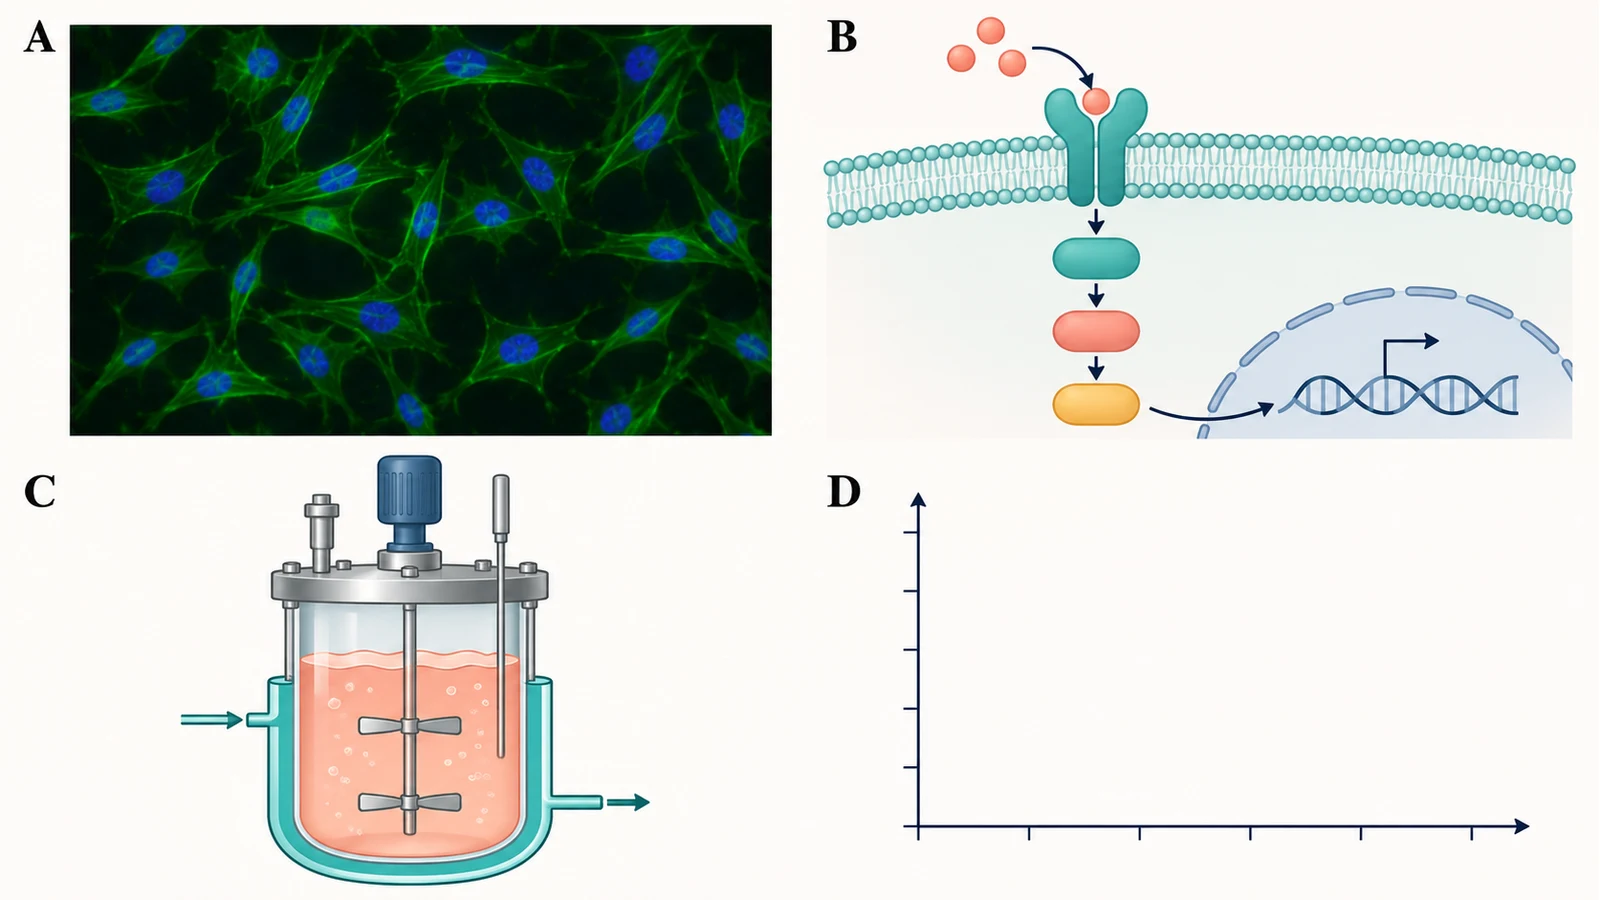
A common mistake in academic slide preparation is pasting screenshot bitmap crops of multi-panel journal figures directly onto presentation slides:
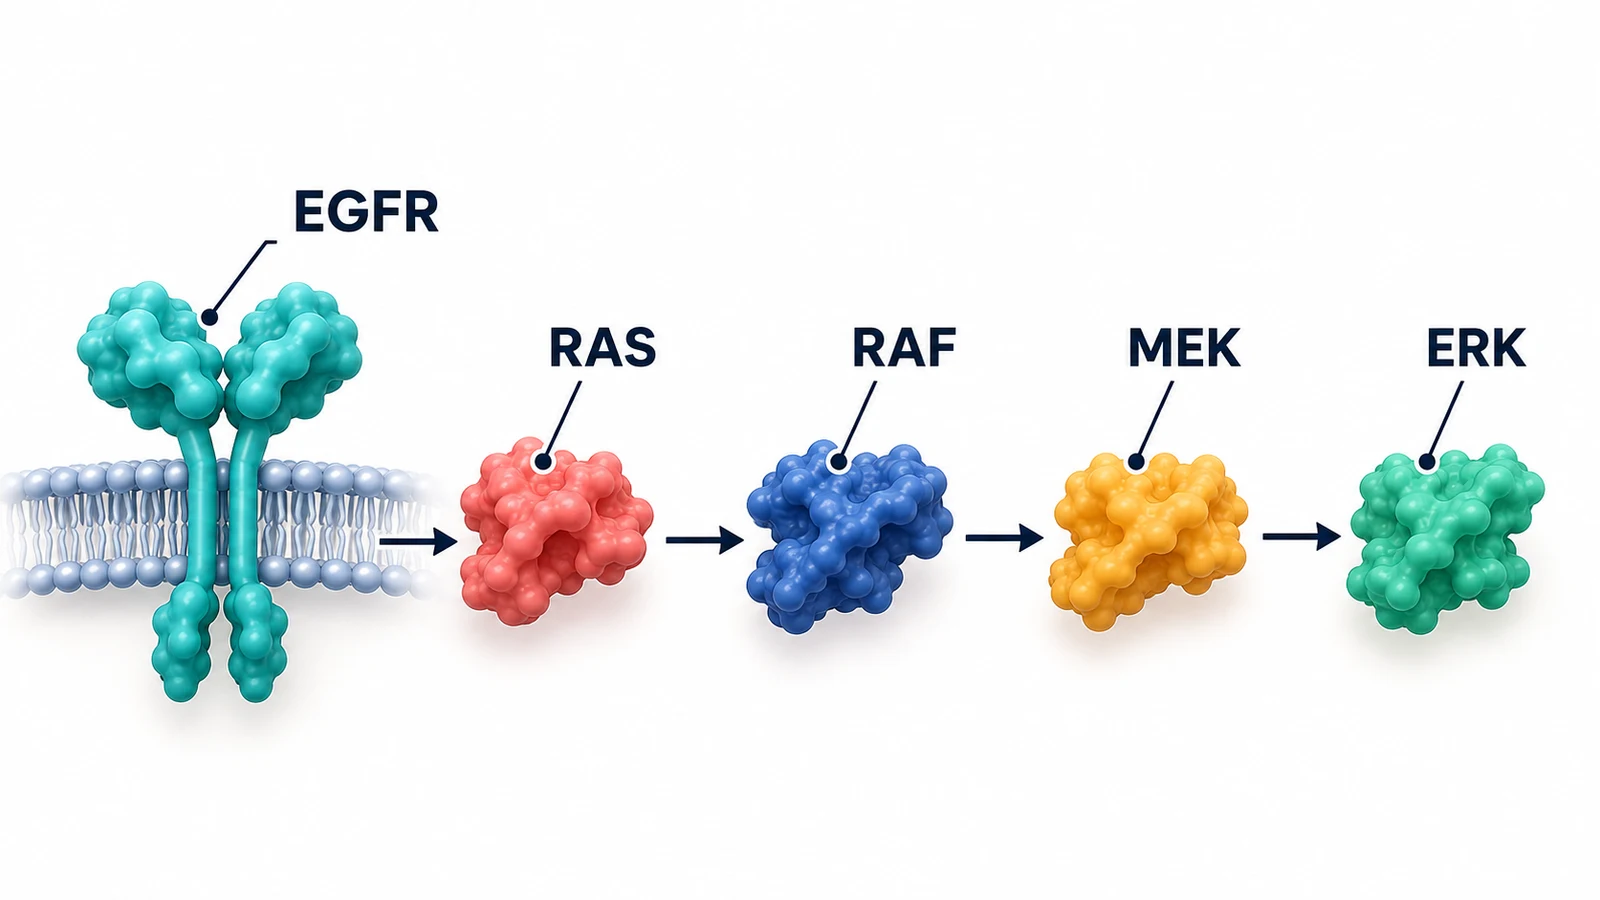
SciDraw's conversion engine utilizes intelligent vector decomposition to reconstruct the underlying graphical hierarchy:
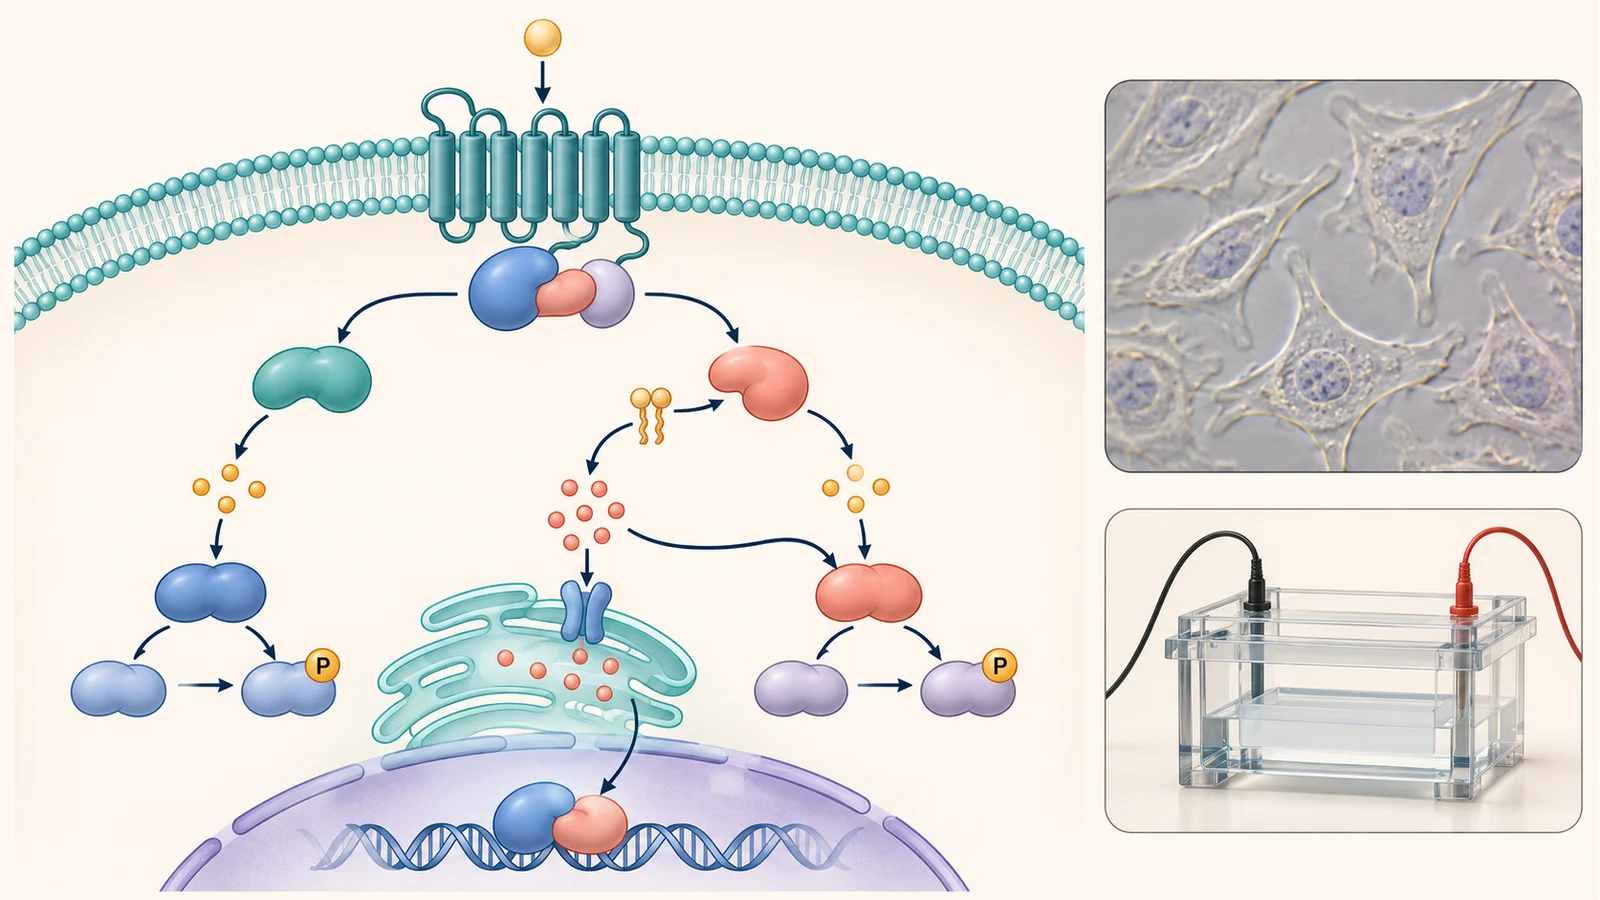
When using converted figures in academic lectures, symposiums, or webinars, adhere to professional copyright and attribution protocols:
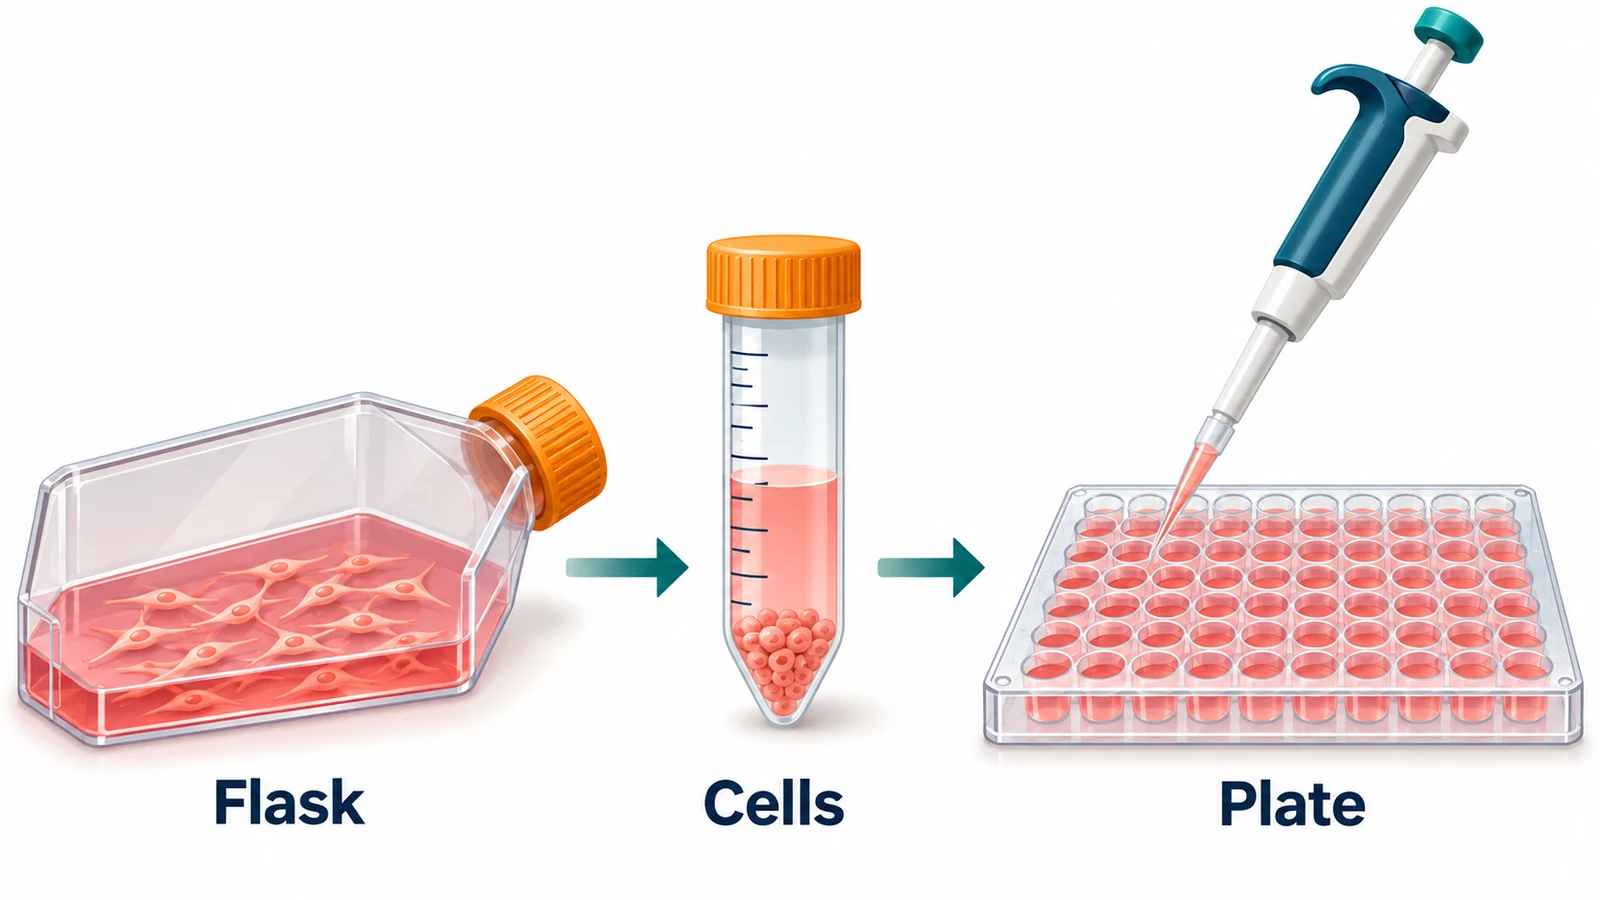
A single pathway or mechanism figure often serves multiple communication needs—from a two-column manuscript panel to a 16:9 conference slide or grant schematic. Plan your visual hierarchy so labels and compartments remain clear across formats:
Choose your plan. No hidden fees, cancel anytime.
Your data is yours · Never used to train any model · Encrypted in transit and at rest
Great for getting started
Includes
Best for regular creation
Includes
Built for high-volume production
Includes









Researchers, graduate students, and educators share how SciDraw helps them create scientific figures, scientific diagrams, graphical abstracts, and clearer teaching visuals faster.
For a plant-cell lecture, I needed the chloroplasts and vacuole called out without rebuilding an old slide. SciDraw gave me a useful scientific figure layout that went into my slide deck after only a few label edits.

Dr. Helen Vance
Cell Biology Professor
When a student asks for a force-diagram example beyond the textbook, I open SciDraw instead of redrawing one on a slide. It is the scientific diagram generator I reach for first, then I quickly check every vector.

Dr. Javier Ortega
Physics Instructor
For grant proposals, we use SciDraw to agree on the experimental setup diagram before anyone starts polishing the scientific figure. It has cut down the back-and-forth and given the team a shared visual from day one.

Dr. Devendra Verma
Research Lab Director
I can compare a few biological pathway diagrams for study notes before I settle on one.

Minh Nguyen
Graduate Science Student
For my dissertation, I start the manuscript-to-figure process with neural-pathway and synapse layouts in SciDraw. It gives me a strong first composition, so I can spend Illustrator time on the details that matter.

Dr. Ananya Rao
PhD Candidate · Neuroscience
The first scientific drawing got our fractional-distillation design review moving right away.

Dr. Marcus Davis
Chemical Engineering Lead
If the stock image does not match that week’s climate topic, I make a quick diagram in SciDraw. It gives the class a visual that fits the discussion, and I can tailor the labels to their level.

Prof. Mei-Ling Zhao
Environmental Science Educator
I see authors use a scientific figure generator to turn a rough outline into something reviewers can actually read. It makes the first review conversation clearer and helps the science stand out from the layout.

Dr. Thomas Ødegård
Scientific Journal Editor
For tectonics classes, I use a custom volcano cross-section diagram when the stock image does not match the boundary we are discussing. Students grasp the process much faster when the visual follows the exact example.

Dr. Fatima Al-Sayed
Geology Lecturer
It gives me a tidy scientific figure draft for a force diagram or wave sketch quickly, without making the curriculum page feel crowded.

Dr. Nathan Brooks
STEM Developer
I place a simple materials-science diagram next to SEM images so students can connect an ideal lattice to the real sample. That visual comparison makes the lesson click much faster than another paragraph of explanation.

Dr. Clara Sommer
Materials Researcher
Before opening CAD, we use SciDraw’s architecture diagram generator to make the system boundary and handoffs visible. It gets the right questions onto the table early and helps the team align before detailed modeling.

Dr. Robert Söderberg
Mechanical Engineer
For photosynthesis slides, I start with a chloroplast scientific figure that I can tailor to the level of the class. It saves a surprising amount of preparation time when a lesson needs a fresh visual.

Dr. Hannah Weber
Plant Biology Researcher
It gets me past the blank page on a science explainer and gives the final illustration a clearer direction.

Ji-Min Kim
Scientific Content Creator
Having students create a scientific drawing for a lab report makes them think through the process step by step. The discussion and revision afterwards are noticeably stronger.

Dr. Sofia Alvarez
Biochemistry Professor
It is helpful when we need an astronomy diagram for the exact orbit or instrument configuration in the discussion, rather than a generic solar-system graphic. The result feels much closer to the research question.

Dr. David Park
Astronomical Researcher
A labeled ecology figure gives our postdoc meetings something concrete to point at when we discuss feedback loops. It keeps the discussion focused and helps us reach a paper figure faster.

Dr. Lisa Wang
Ecology Postdoc
For multi-panel papers, I use the manuscript-to-figure workflow to decide what each panel needs to do before Illustrator. It makes the first layout decisions faster and leaves more time for the final polish.

Carlos Ortega
Illustrator Assistant
For early circuit and network reviews, I use SciDraw’s architecture diagram generator to get a first pass on the page. The team can mark it up together instead of building slides from fragments, which makes decisions quicker.

Dr. Elena Gomez
Systems Engineering Lead
For public-facing science guides, clear scientific diagrams often travel better than a dense block of text. They make complex ideas easier to share across languages and give us a strong starting point for the final guide.

Dr. Michael Achebe
Science Communicator
 Research
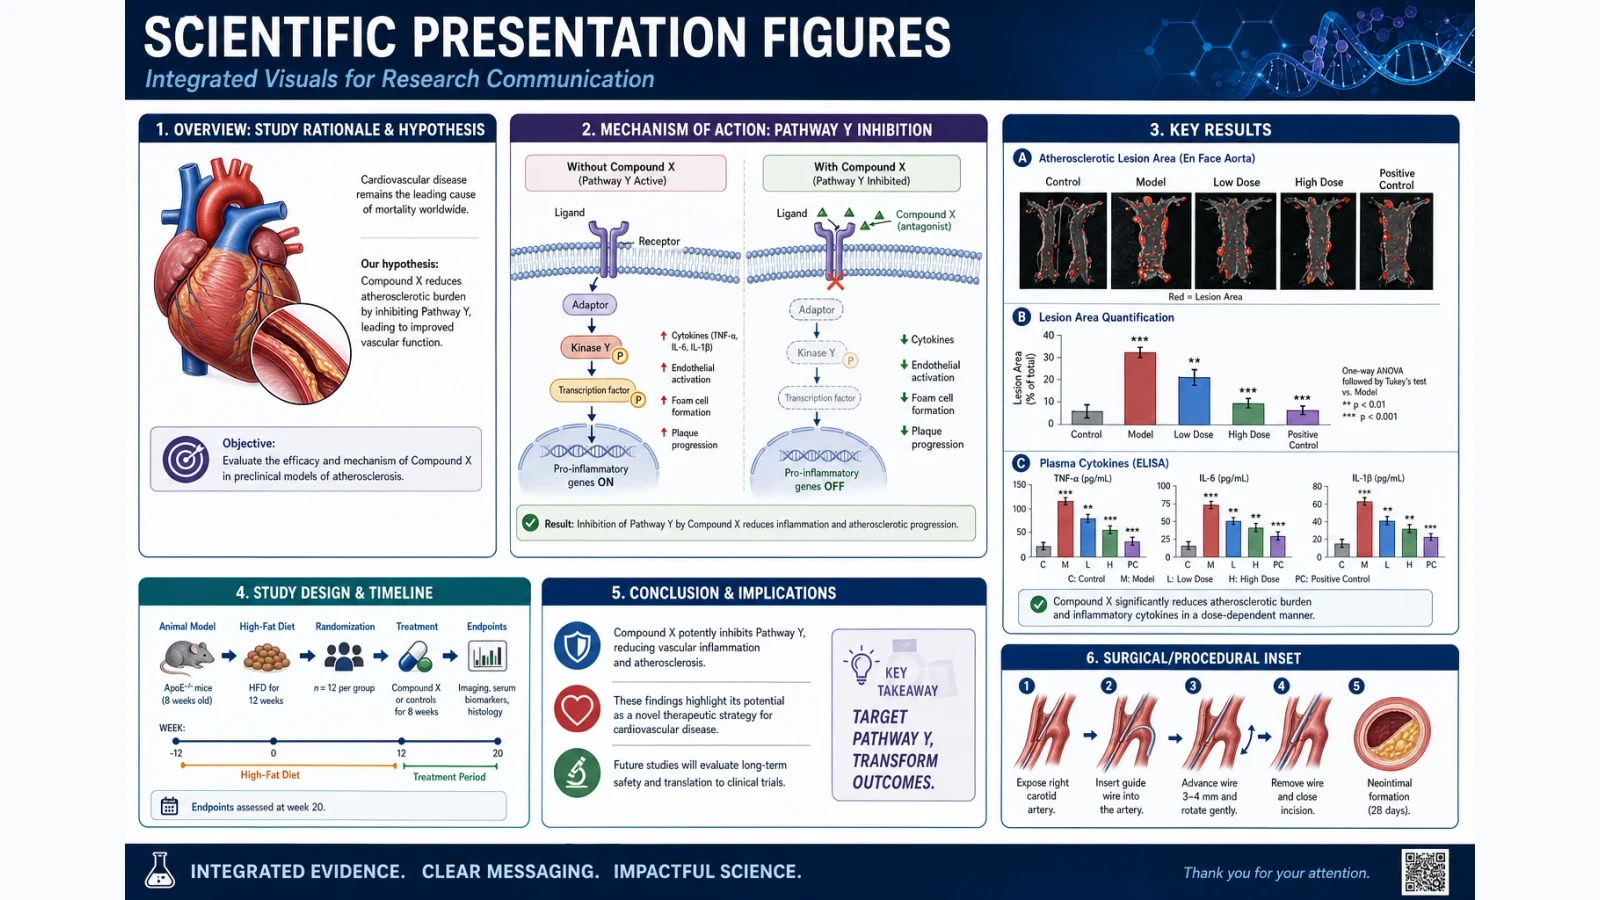
Slide-ready figures for conferences, journal clubs, grand rounds, and lectures.
 Research
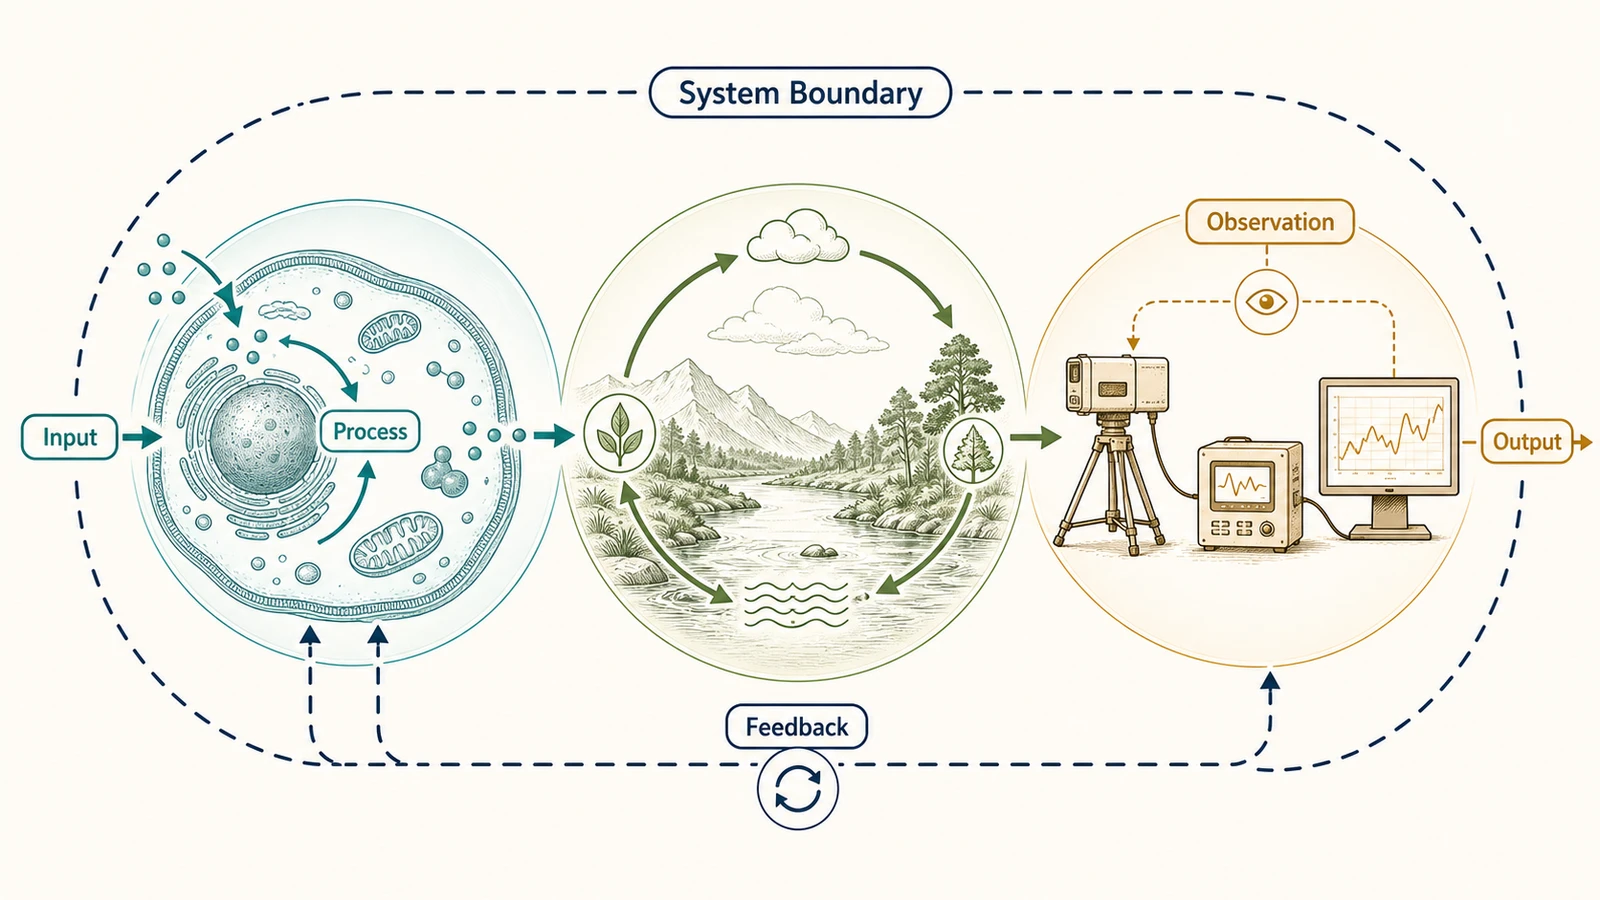
Create technical diagrams for experimental setups, apparatus, and processes.
 Research
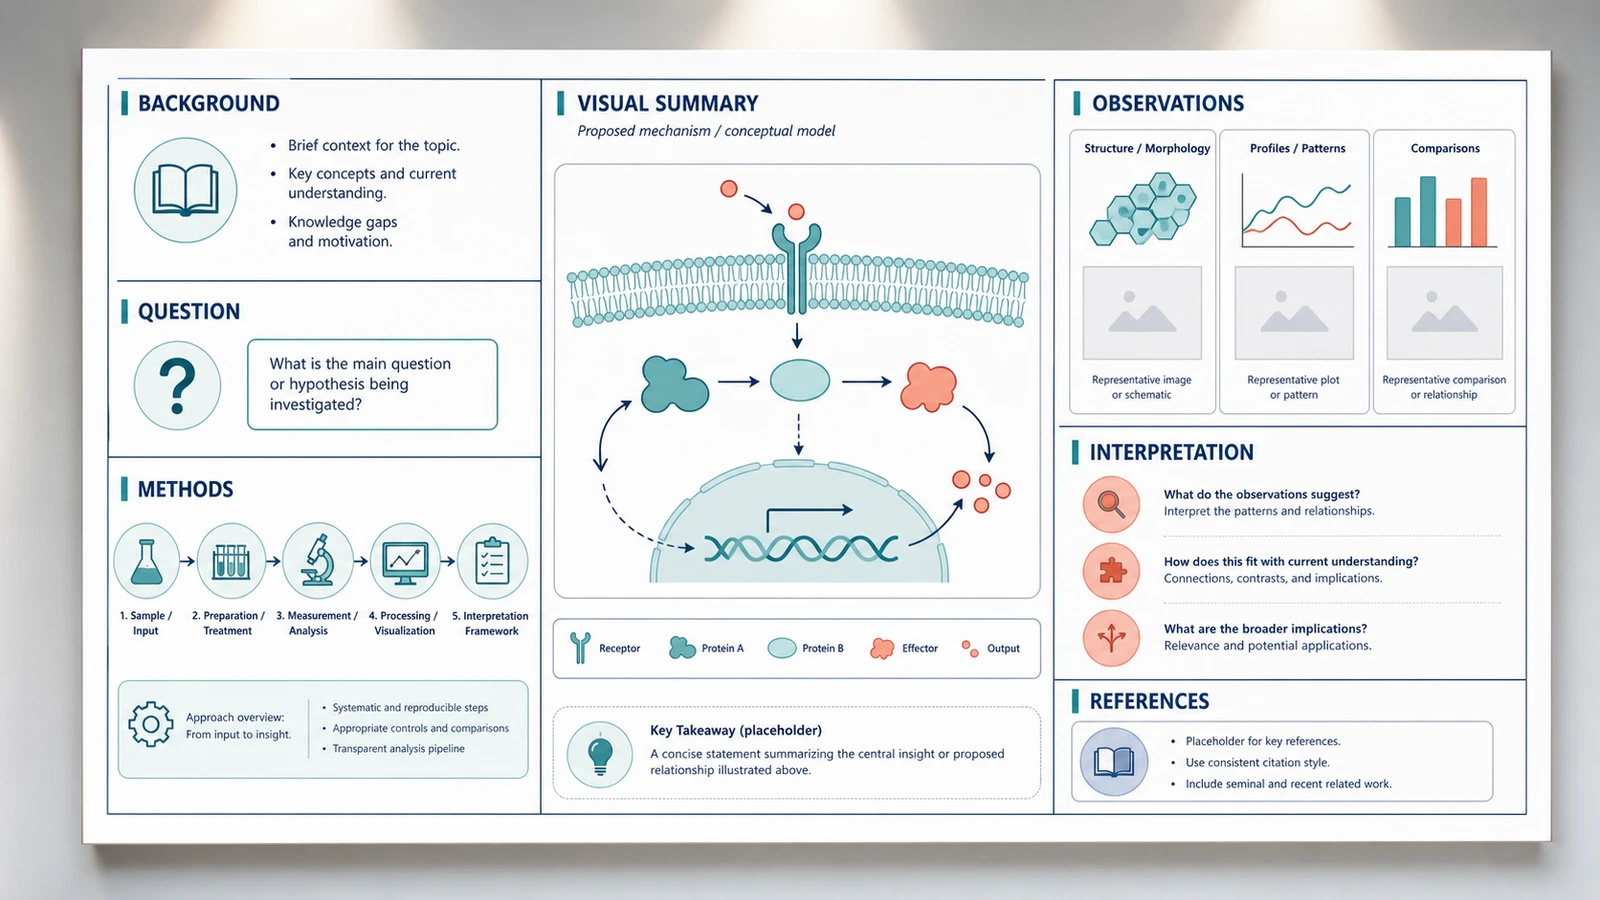
Design publication-grade research posters for academic symposia and conferences.